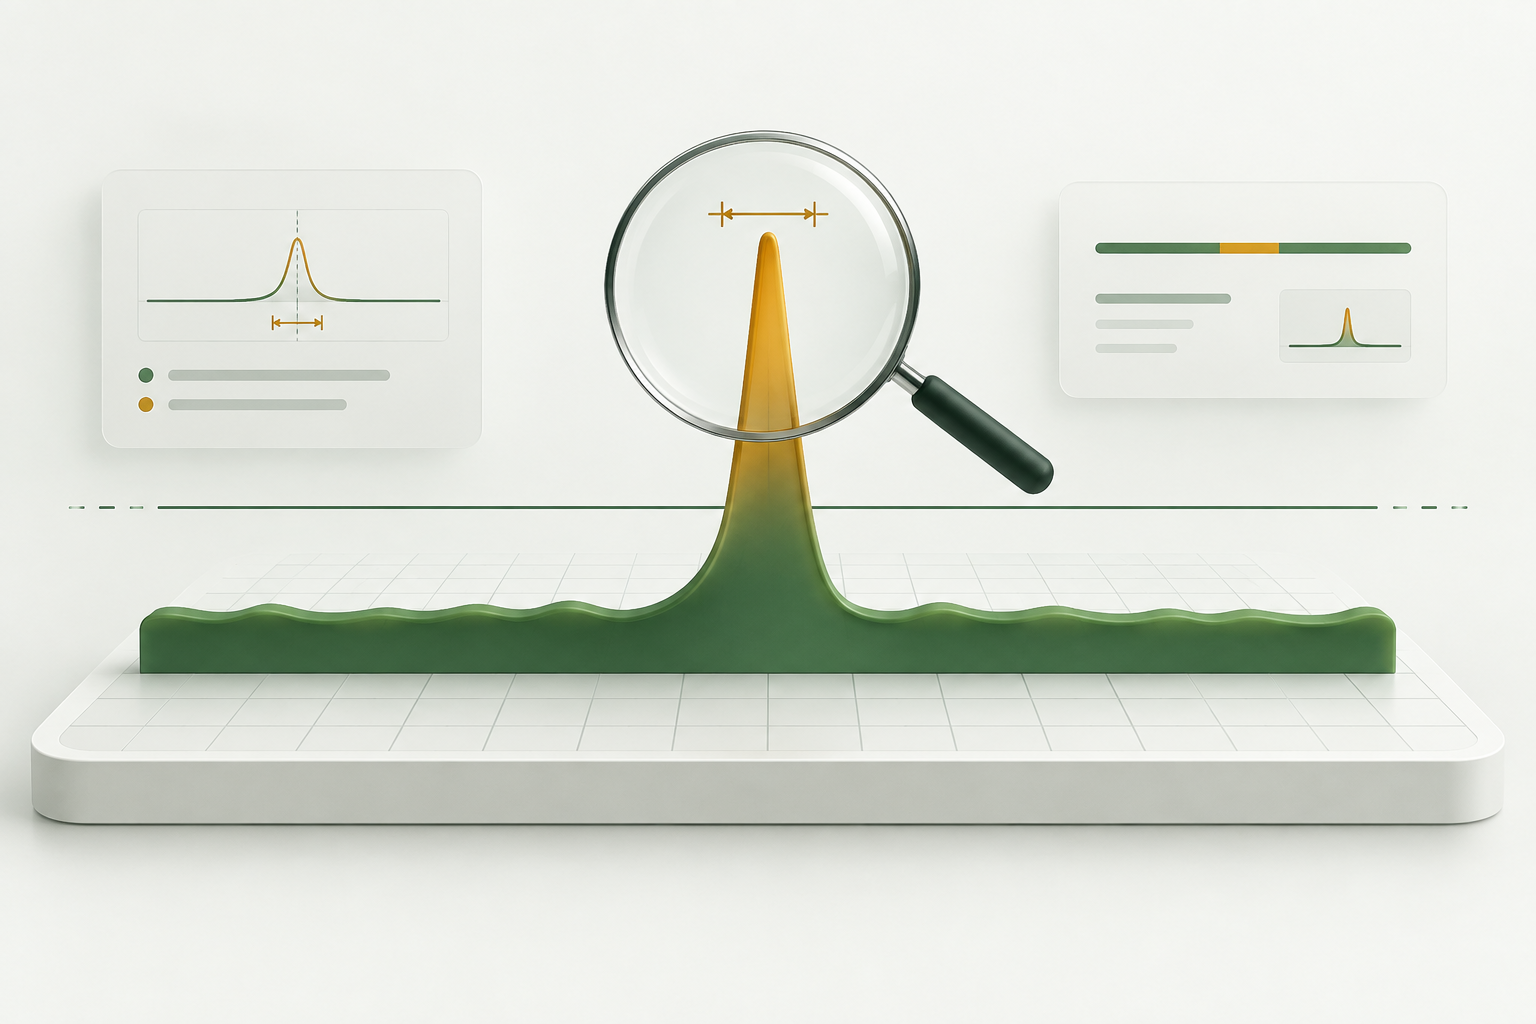
Data quality first
Gaps, daylight-saving clock changes, units, and unusual values become visible before key figures are interpreted.

OPTUM Energy Tools · Free Browser Version
OPTUM Load Profile Compass
Analyze load profiles online for free – for businesses: Identify consumption, base load, and peak loads – directly from your Excel or CSV file. For electricity, also include historical spot prices.
One of our public tools for greater energy transparency. This compact browser version helps you identify the questions your data raise.
Your entry point · In three steps
Select electricity or gas load profile. The app recognizes matching measurement series and only asks for clarification if something remains unclear.
Excel (.xlsx, .xls), CSV, TXT or TSV
Usable on smartphones and tablets. For large files, tables, and detailed diagrams, we recommend a desktop browser.
Automatic orientation, not binding advice. No guarantee for accuracy, completeness, and timeliness, to the extent permitted by law. Mandatory statutory liability remains unaffected. Terms of Use
What you will receive
Each result explains how it came about, what it means, and where its limitations lie.

The file is read and analyzed in the browser. No public price data is requested without your click. A price request only transmits the necessary monthly identifiers, not measurement data. As with any request, the price archive provider sees the IP address.
Gaps, daylight-saving clock changes, units, and unusual values become visible before key figures are interpreted.
Time series, heat map, load duration curve as well as daily, weekly and monthly views make operational processes tangible.
Not just a maximum: timing, frequency and surrounding load profile form the basis for targeted tests.
Assumptions, findings and methods are exported together – without uploading customer data.
Understand file · Check locally
The start of the table, timestamp columns, unit and measurement interval are checked together. If these are unambiguous, the analysis opens directly.
Workspace · local on your device
Demo load profile
–
Enhanced features include additional charts, custom time periods, and electricity price comparison. You can switch back at any time.
Your starting point: View data quality, check load curve, save report. For price comparisons and further charts.
Automatic orientation, not binding advice. No guarantee for accuracy, completeness, and timeliness, to the extent permitted by law. Mandatory statutory liability remains unaffected. Details on data & liability
Your starting point: First check data quality, then classify trends and anomalies. The key figures here apply to your entire file.
Time course
Local calendar days in Europe/Berlin. The excerpt changes the chart and its assessment; the five overall indicators remain relative to the entire file.
Hover over the graph: View measurement and comparison. Click or use arrow keys: Select measurement. Tap: Select measurement and read the information below.
Check how often, for how long, and by how much the measured power exceeds a user-defined limit. This will help prepare for a discussion about load management.
Starting value: P95, minimum 0 kW. This limit is part of the diagram; the peak threshold under Consumption & Pattern is separate. The limit remains the same when switching months until you change it. It is not a confirmed connection value. The energy above this value is neither a guaranteed saving nor the required storage capacity; load shiftability, charging times, and losses are not modeled.
This assessment follows the selected chart period. All statements are calculated locally from your measured values.
Understanding abnormalities
The time proportions indicate whether the system is operating predominantly at low or high power levels. Energy quantities are shown alongside; negative readings remain separate. The ranges adjust to the positive maximum of the selected diagram.
| Power range | Time recorded | Time share | Positive energy | Negative energy, absolute value |
|---|
Consecutive deviations are grouped together as an event. A normal operational sequence, a public holiday, or changes in production can also be noticed. Therefore, first check the date, duration, and comparative values.
Methodological background: NIST · Median and robust outlier testing. The comparison groups and minimum deviations are our documented product rules.
Mean: puts the general power level in context. P10: 10% of readings are at or below this level; a starting point for checking continuously running equipment, not an identified baseload. P95: 95% are at or below this level; helps put high loads in context. Maximum: highest interval average, not an instantaneous peak. The lines apply to the selected chart period.

100 kW × 15 minutes = 25 kWh.
kW describes the power level. Only the duration converts this into energy in kWh. Therefore, a high peak power alone is not enough to infer significant savings.
The chart, verbal description, and pattern comparison follow the selected chart period. The five key figures at the top, the top five, and the data quality check apply to the entire file. For long series, the minimum and maximum values are retained for each display section.
Top 5
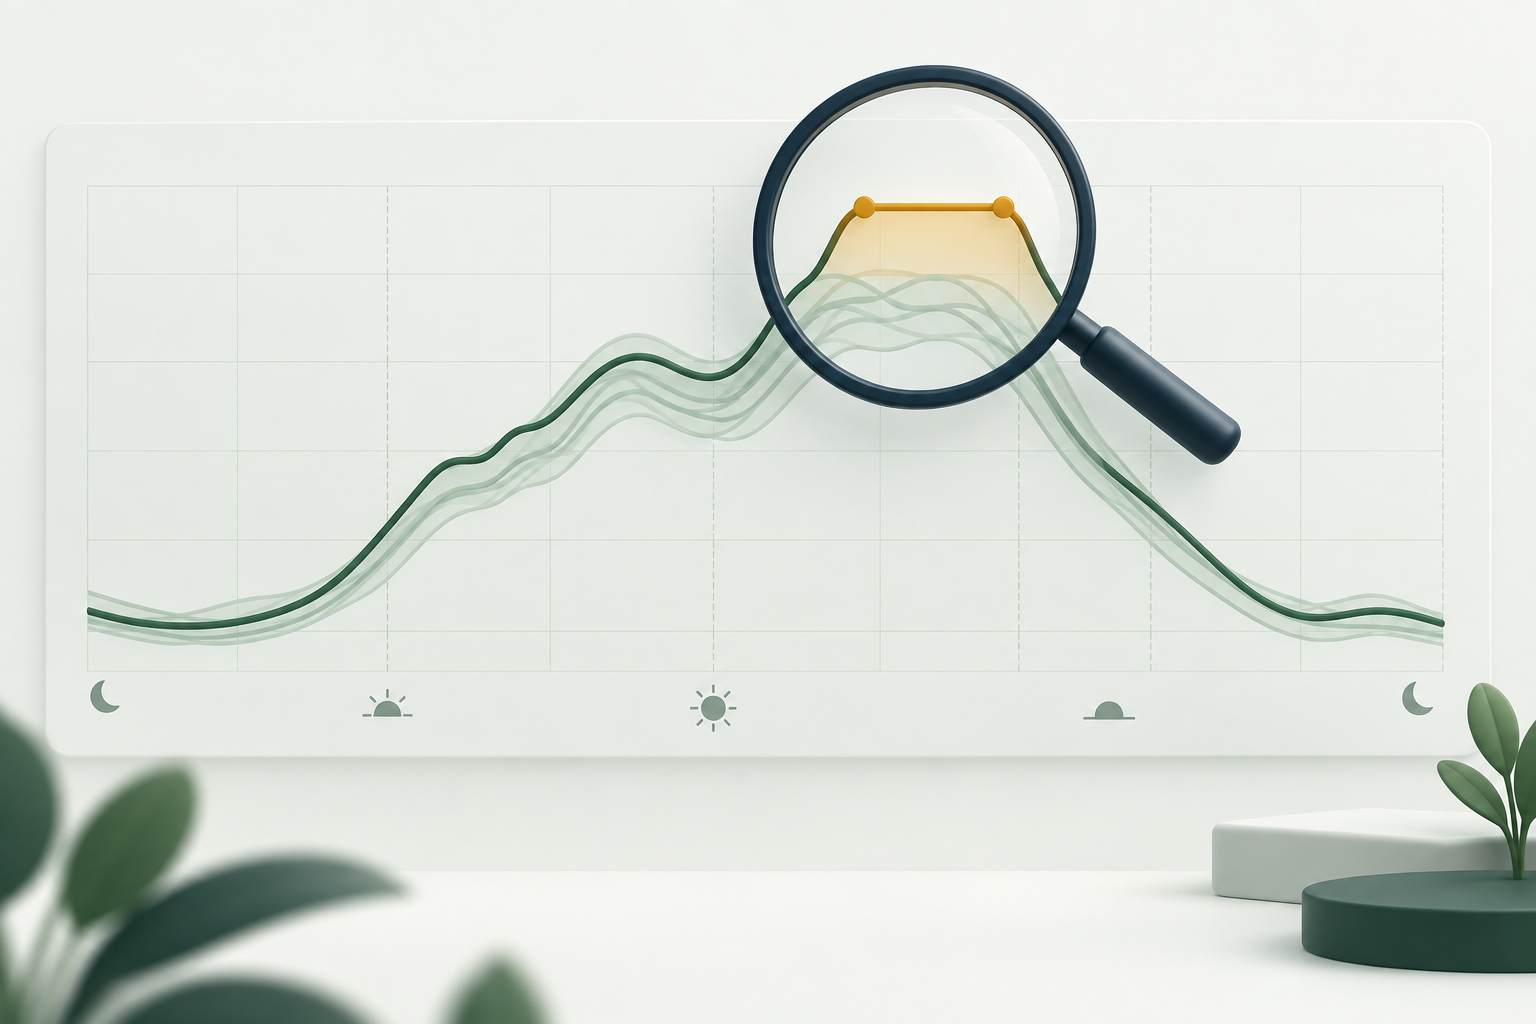
The height indicates the power demand. The duration also determines the amount of energy involved. When observing a spike, also check the adjacent intervals and the operating sequence.
Multiple entries can belong to the same peak event. Consecutive events can be found under Consumption & Patterns.
Before interpretation
Gaps or incorrect units will alter the message. First, check the findings, and then the assumptions in your file.
Test report
Next Steps
Details & Patterns
Identify recurring patterns, demand outside of business hours, and individual peaks. First, select the detailed time period. This selection does not change the key figures in the overview.
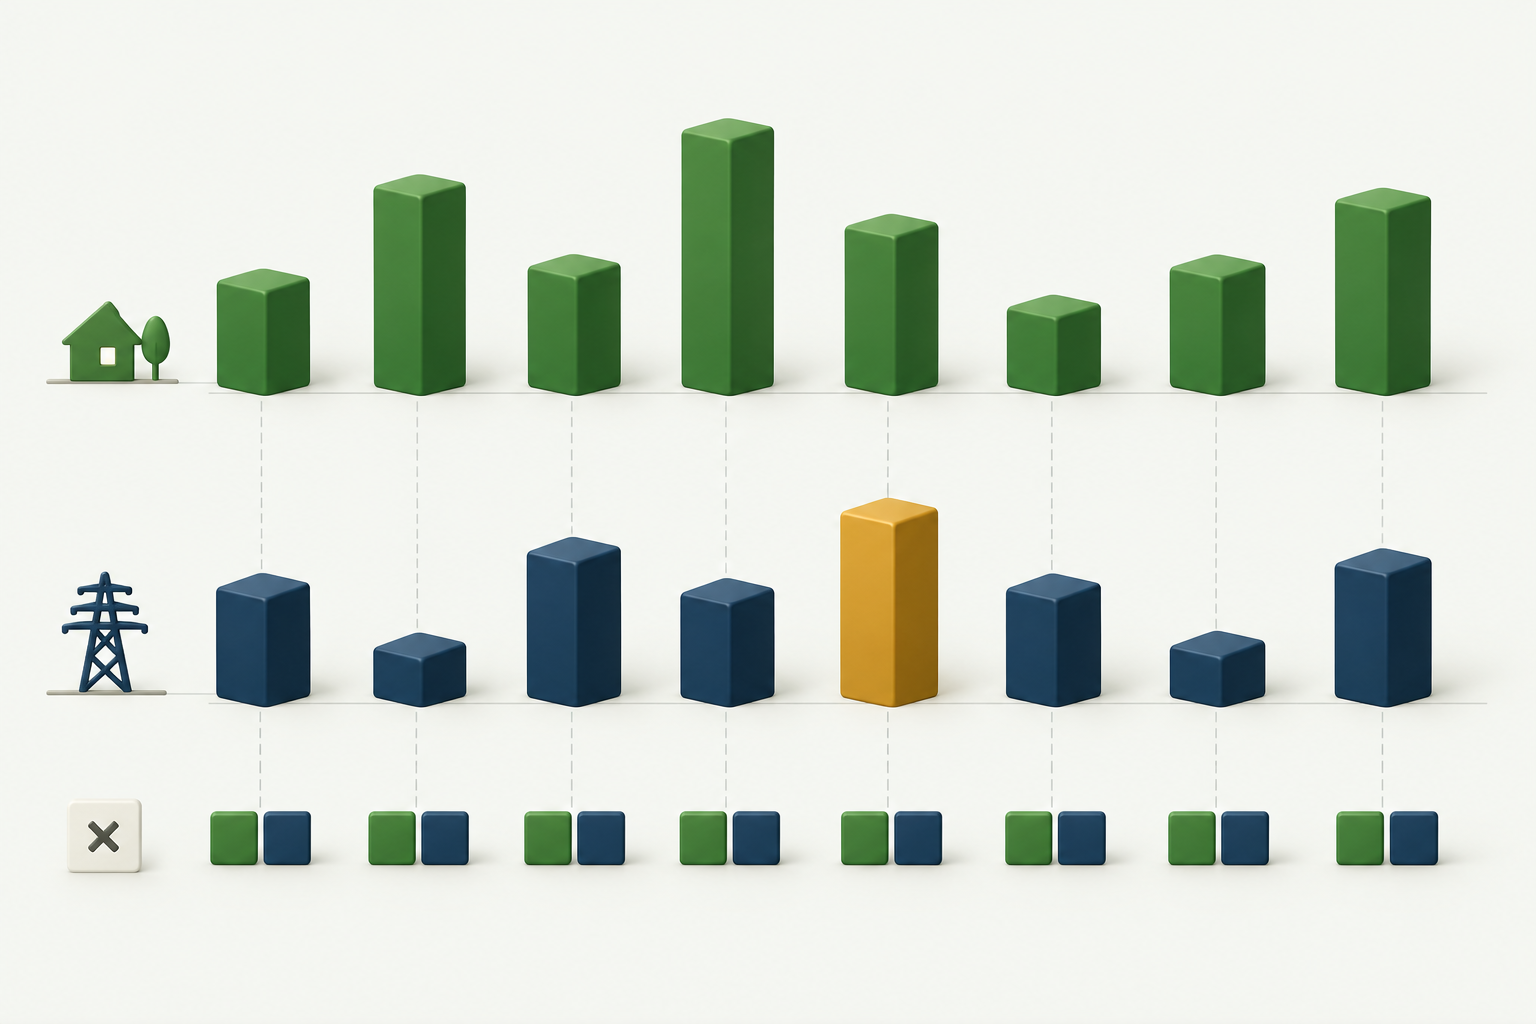
An extra shift, a public holiday, weather, or a measurement problem can alter the trend. First, compare similar days. Then, check operating hours and measurement quality before identifying a cause.
P10 describes a low load level, not an identified technical base load. Percentiles are linearly interpolated between adjacent rank values. All calculations use complete measured values; only the chart display is condensed.
The heat map makes recurring periods visible: horizontal patterns show daily routines, changes over several days may indicate a change in operations.
Each cell shows the average power for a local hour. Move the pointer over the map.
Grey hatching indicates no measured values (not 0 kW). The non-existent spring hour remains empty; both autumn hours are combined using a time-weighted average.
Interval power values sorted in descending order. The horizontal axis shows recorded hours, not calendar time. Missing intervals are not filled in; negative values also remain visible.
Groups may overlap and should not be added together. High load outside the plan is an audit indicator, not confirmed waste. Public holidays are not guessed without a site calendar.
Daily criteria: only complete days, at least eight comparison days in the same month and day type (Mon-Fri / Sat-Sun), excluding explicit holidays. Limit: Q1 − 1.5 × IQR to Q3 + 1.5 × IQR. Level change: average power of consecutive complete weeks changed by at least 25%. These are transparent search rules, not standard limits. Regular patterns and seasonality can be examined in profiles and monthly values; determining the causes requires operational information.
Gas · Understanding consumption
Your gas energy consumption, power, peaks and consumption patterns have been evaluated. The day-ahead electricity price series and high-/low-rate electricity tariffs do not fit a gas load profile and are not offered here.
A reliable gas price comparison requires the agreed-upon gas index, market area, gas day, pricing formula, and contract surcharges. This gas price allocation is not yet included in this browser version.
Classify gas procurement with OPTUM ↗Retrospective · 100% Spot Market
Your measured consumption. Same period. The market price at the time for each interval.
We calculate as if you had purchased the entire attributable quantity at the respective day-ahead spot prices: fully dependent on spot prices, without fixed-price hedging. Your actual consumption remains unchanged.
That's just the energy cost. Network charges, taxes, levies, supplier surcharges and a basic price are added to a real electricity tariff.
25 kWh × 8 ct/kWh = €2 in exchange energy. This calculation is performed for each suitable interval. All amounts are then added together. If prices are missing, the corresponding quantity is shown as unpriced.
Day-ahead means the price traded the previous day for the respective delivery interval. The spot market also includes intraday trading; this is not represented by the public day-ahead series shown here. “100% spot” means the price is fully linked to this series; it is neither a guaranteed lowest purchase price nor a forecast.
The following click loads public monthly archives. The mapping to your measurement data is done locally. Only the required months are transmitted; the price archive sees your IP address, but not the load profile.
SMARD Day-Ahead CSV file with start, end, and price. Your previously verified load profile assignment will be used. Check the market area and unit of the price file. The app checks the time and figures; the origin and market type of the file are not externally verified.
HT is the peak tariff, NT the off-peak tariff. Enter the energy unit prices in ct/kWh and the switching times from your contract. This is a separate tariff calculation, not a market price. Outside the peak tariff window, the off-peak tariff applies.
| Month | HT kWh | NT kWh | Energy costs |
|---|
What would the same priced quantity have cost at a constant energy price? Enter only the pure energy cost, excluding network charges, taxes, or other surcharges. You cannot meaningfully compare the total price of your electricity bill here.
Assessment: The comparison shows how the selected period performed. It says nothing about future prices. A fixed price makes the agreed energy share predictable; network charges, taxes, levies, and surcharges are generally not included. Spot-price-dependent procurement offers opportunities when market prices are low but carries the risk of high prices. Which procurement method is suitable also depends on your company's need for predictability, budget, and risk tolerance.
Your profile makes the difference
Power in kW is shown at the top, and the corresponding price in ct/kWh is shown at the bottom, both on the same time axis. Gaps are not connected. The display is condensed while retaining extreme values; exact values are shown in the interval table. Selecting a month only changes the comparison and the table, not the total costs.
| Month | Priced kWh | Unpriced kWh | Cost € | Weighted ct/kWh | Priced intervals / import |
|---|
| Start (Berlin, CET/CEST) | End | Energy kWh | Price ct/kWh | Cost € | status |
|---|
Retrospective 100% spot comparison: Each clearly attributable quantity of grid electricity is valued at the price of its actual consumption interval. Public price basis: SMARD day-ahead; for manual import, the selected price series applies. Pure exchange energy, excluding network charges, taxes, levies, supplier markups, or basic price. Not a complete electricity tariff, no forecast, and no guarantee of the cheapest purchase. Negative load values are shown separately, without sales revenue. Missing prices are not zero prices; partial costs are not complete period costs.
Data source: Federal Network Agency | SMARD.de · CC BY 4.0. Processing by OPTUM: Unit conversion and time allocation. Public data may contain gaps or subsequent corrections; the actual coverage of your file is displayed.
Local results
Save the current state with assumptions and limits. Both files will be created on your device.
PDF with key figures, diagrams, findings and available detailed and pricing results.
JSON with detailed results, chart analysis, and existing price assignment including price comparison. For technical processing only; not a project to be reopened.
Detailed values are available after the detailed analysis is complete.
Look up · understand · continue working
Choose a topic or search for a term. Each explanation puts the result into context and suggests a logical next step.
No suitable explanation found. Try a shorter term or select "All functions".
Voluntary · separate from your analysis
Your normal analysis remains local. Only if you wish can you create a data-reduced development profile for OPTUM here. It helps with pattern analysis; it is not a replacement for the original file when troubleshooting import errors.
The original filename, meter and customer data, table metadata, original date, and absolute kW/kWh values will be removed. The start date will be moved to January 1, 2001. Load values will be normalized to the average positive power (= 100) and rounded to one decimal place.
The sequence, time intervals, gaps, relative load patterns, signs, selected industry, and energy type are preserved. The synthetic timestamps provide no information about actual days of the week, seasons, or holidays. The profile is not a real measurement file in kW or kWh.
No guaranteed anonymity: A characteristic load pattern can allow conclusions to be drawn about a business. Furthermore, your sender address will be revealed when sending emails. Please only share files that you are authorized to share.
| Synthetic start | Synthetic end | Relative load | Industry | Energy type |
|---|
You choose the delivery method. For email, attach the downloaded CSV file yourself and send it to info@optum-eba.de. Direct sending will remain disabled until the recipient's endpoint is set up separately. This page does not permanently store or transmit the data before you forward it yourself. Information on the processing of incoming emails: OPTUM Privacy Policy.
Descriptive key figures and costs are calculated from clearly matching public price intervals. No unknown consumption distribution is invented where load intervals are coarser than price intervals. Device states, PV/storage shares, reactive power, weather-adjusted savings, and their causes require additional data. Price forecasts, HPFC, grid fee calculations, block optimization, risk models, or reBAP models are not included. The results serve as an initial assessment and discussion point, not a quotation, and do not guarantee savings.
One processing core · two versions
Local testing and analysis directly in the browser. If the browser encounters a known technical limitation, it will be explained in detail.
Planned for later release. Currently, there is no finished desktop app available for download.
Each anomaly should indicate the method, severity, affected intervals, uncertainty, and next step in the review process.
Load profile knowledge for companies · OPTUM EBA
Your energy bill shows how much you have consumed. Your load profile additionally shows when the energy was needed: at the start of production, during a night shift, on weekends, or during a shutdown. Understanding these differences allows you to ask more targeted questions and better prepare your energy procurement.
With the OPTUM Load Profile Compass , you can analyze your load profile free of charge – directly from Excel or CSV, without registration. You receive a load curve, comprehensible key figures, and a written evaluation with specific timestamps. Your measurement file and the calculations remain on your device during normal analysis.
Read according to your interests: You can always access the relevant topic via "Contents". The benefits and limitations of the five perspectives can be expanded individually.
From measurement value to decision
Select your question. The cards show what the compass contributes and what additional information you should provide. The respective link leads directly to the relevant explanation.
A finding becomes a concrete test step – with date, traceable measured values and the appropriate operating information.
The basis
A measured load profile represents power or energy over time. For electricity, quarter-hourly values are common, while for gas, hourly values are frequent. A single line connects a point in time with a measured value. Many lines together create a picture of your operation: steady or fluctuating, active during the day or around the clock.
A full year of 365 days, with continuous quarter-hourly measurement, contains 35,040 intervals. This temporal resolution can reveal correlations that remain hidden in twelve monthly statements. A standard load profile, on the other hand, depicts a typical trend; it does not document what actually happened in your company.
A brief peak or persistent demand?
Why your load profile matters for a quote
The annual consumption alone is not sufficient for a customized electricity offer. The supplier needs to assess at what times your company requires how much electricity. Your measured load profile helps them to forecast future demand and procure the appropriate quantities. Weekend consumption, shift work, and seasonal downtime all shape this profile.
Market prices vary depending on the delivery time. Two businesses can require the same amount of electricity but have differently priced consumption profiles. With individual calculations, profile costs can be factored into the offered energy price – even a fixed price. The specific handling of this depends on the procurement product and contract.
The offer also reflects the market level and purchasing time, delivery period, volume flexibility, risk premiums, and sales costs. Network charges, taxes, and other components may also apply, depending on the offer. A historical spot-price comparison illustrates the effect of timing; it does not calculate a binding supplier price.
Your advantage as a client: With an understanding of the load profile, you can discuss offers based on the same data. Inform OPTUM about new shifts, additional machines, a planned PV system, or extended shutdowns. This allows us to check whether the past profile still adequately describes future demand.
Practical example of individual profile calculation: Vattenfall explains the evaluation of a delivery schedule and the profile surcharge ↗. General assessment: enercity on electricity trading ↗.
← Back to question overviewFive perspectives on your data

Daily and weekly profiles show whether your load follows operating hours. Recurring increases may correspond to the start of a shift. A constant level at night or on weekends may indicate appliances that run continuously. Continuous operation can also be distinguished from operation with a weekend break.
Your benefit: You can focus the audit on specific time periods instead of searching the entire operation for possible causes. In discussions with building services or production, "We're consuming too much" becomes the question "Which systems were running on Sunday between 2 and 6 a.m.?"

The compass displays the highest interval power, along with the date and time. It also shows significant changes between consecutive measurements. A user-defined power limit reveals how frequently and for how long the load exceeds this limit. The load duration curve indicates whether high power is required infrequently or for extended periods.
Your benefit:You receive a concrete approach for reviewing plant start-ups and simultaneous processes. The engagement can also include consideration of relevant contract and billing conditions. This additional information is needed to determine whether load shifting is technically feasible or economically viable.

The import function searches for matching time and measurement columns and checks the intervals. Unclear units, duplicate times, and gaps are highlighted. Measured zero values remain separate from missing values. For statistical anomalies, the app compares relevant days of the week and times of day, provided enough reference days are available.
Compare periods before and after the measure with similar operating times and production volumes. For heating and cooling, include weather conditions. First check data coverage and document when the measure was implemented. Lower measured consumption can also result from less production, a shutdown or milder temperatures. The Compass shows the trend; it does not provide an adjusted savings calculation or automatic proof of effectiveness.
A consistently higher load level, a recurring increase, or additional consumption outside of normal operating hours can indicate new electrical loads, longer operating times, or altered processes. The compass visualizes such changes over time and in week-by-week comparisons. Compare this period with commissioning events, shift changes, or production adjustments. This allows you to examine what has changed in operations; a specific system cannot be identified solely from the overall load profile.
Your benefit: You can see which results can be reliably classified and where the data basis first needs to be clarified. The date and duration of an unusual period help with comparison with maintenance logs, company holidays, or changes in the shift schedule.
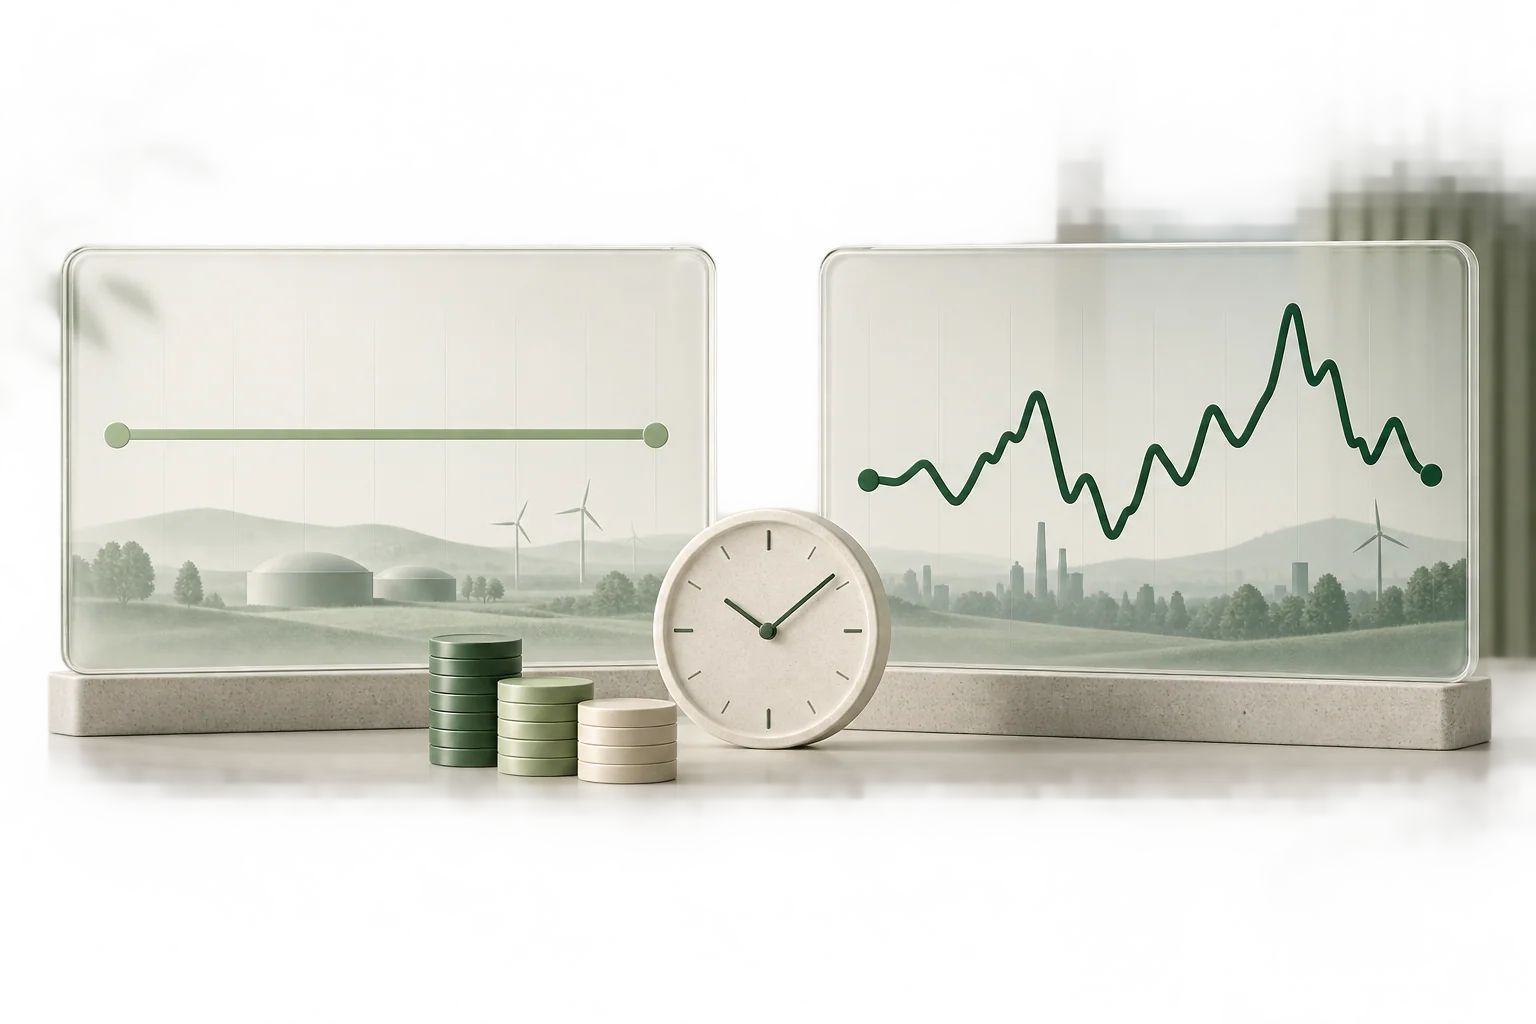
The same annual volume can result in different energy costs when prices vary over time. The Compass can align your grid electricity imports with historical day-ahead prices. The consumption-weighted price shows which prices applied when you actually used the electricity. You can also enter your own fixed energy price and high- and low-tariff rates for comparison.
Your benefit:You will gain a clear basis for discussing fixed prices, spot prices, and your operational flexibility. You will understand why a general electricity exchange average alone does not describe your individual consumption costs.

The compass describes selected findings with measured values and specific timeframes. Each observation is followed by an assessment and the next step in the review process. This allows anomalies to be discussed with management, purchasing, and technical staff even without prior knowledge of diagrams.
Your Benefits: The OPTUM PDF report records key figures, mapping, notes, and a clear analysis. It provides a common starting point for decisions and queries. The selected chart period is specified; the key figures for the entire file remain distinguishable.
From the gas demonstration · synthetic learning example
"From August 11, 2025, 00:00, to August 14, 00:00, the energy flow is 40 kW. Over 72 hours, it remains significantly below the usual level of the model business. Measurement data is available – there is no data gap."
The period of low consumption can be precisely defined. In this gas demo, it's modeled as a maintenance break. Under a real load profile, the app doesn't know the reason.
Check the timeframe against your maintenance schedule: Does the duration fit? Which appliances continued to run? Is the restart visible in the load profile? This explanation leads to verifiable questions.
Simplified example from "Gas / Continuous Process & Maintenance", no customer data and no industry benchmark. In the case of gas, kW refers to the energy flow of the gas, not the usable heat output.
Try one of 17 demos ↑Relevant questions for your business
Start with your everyday operations. The industry demos show typical model patterns; your own load profile provides the measurement data for the test.
Compare shift changes, weekend breaks, and continuous operation.
Understanding the operating rhythm ↑ Bakery, businesses & charging pointsCompare periods of high load with start-ups, operational processes, or charging times.
Classify peak loads ↑ Hotel, Retail & RefrigerationDistinguish between continuous demand and time-limited use and inquire about them specifically.
Understand night-time and weekly patterns ↑ Gas & Process HeatDescribe seasonality and breaks; add weather and production information for explanation.
View an example in words ↑A few steps to initial assessment
Select your file, check for any open import questions, and first review the history and data quality. Then you can delve deeper into specific time periods, compare suitable electricity prices, and save the report. If you don't have your own file, 17 synthetic demos, including three gas load profiles, are available.
No file yet?
Ask your energy supplier, grid operator, or responsible metering point operator for the measured load profile of your delivery point. Ideally, request this data for a full year, in Excel or CSV format. A PDF chart is insufficient for an accurate analysis.
Electricity: preferably quarter-hourly values in kW or kWh. Gas: preferably hourly consumption in kWh. Request the timestamp, unit, time zone and meaning of each timestamp.
Please provide me with the measured load profile for my delivery point [market location ID / meter number] for the period [from – to] as a CSV or Excel file. I require individual measurement intervals with date/time, unit, interval length, and an indication of whether the timestamp marks the start or end of the interval. Please specify the time zone, daylight saving time changes, and any existing substitute value indicators. For gas, I prefer the billed hourly consumption in kWh rather than cumulative meter readings.
Explained in pictures
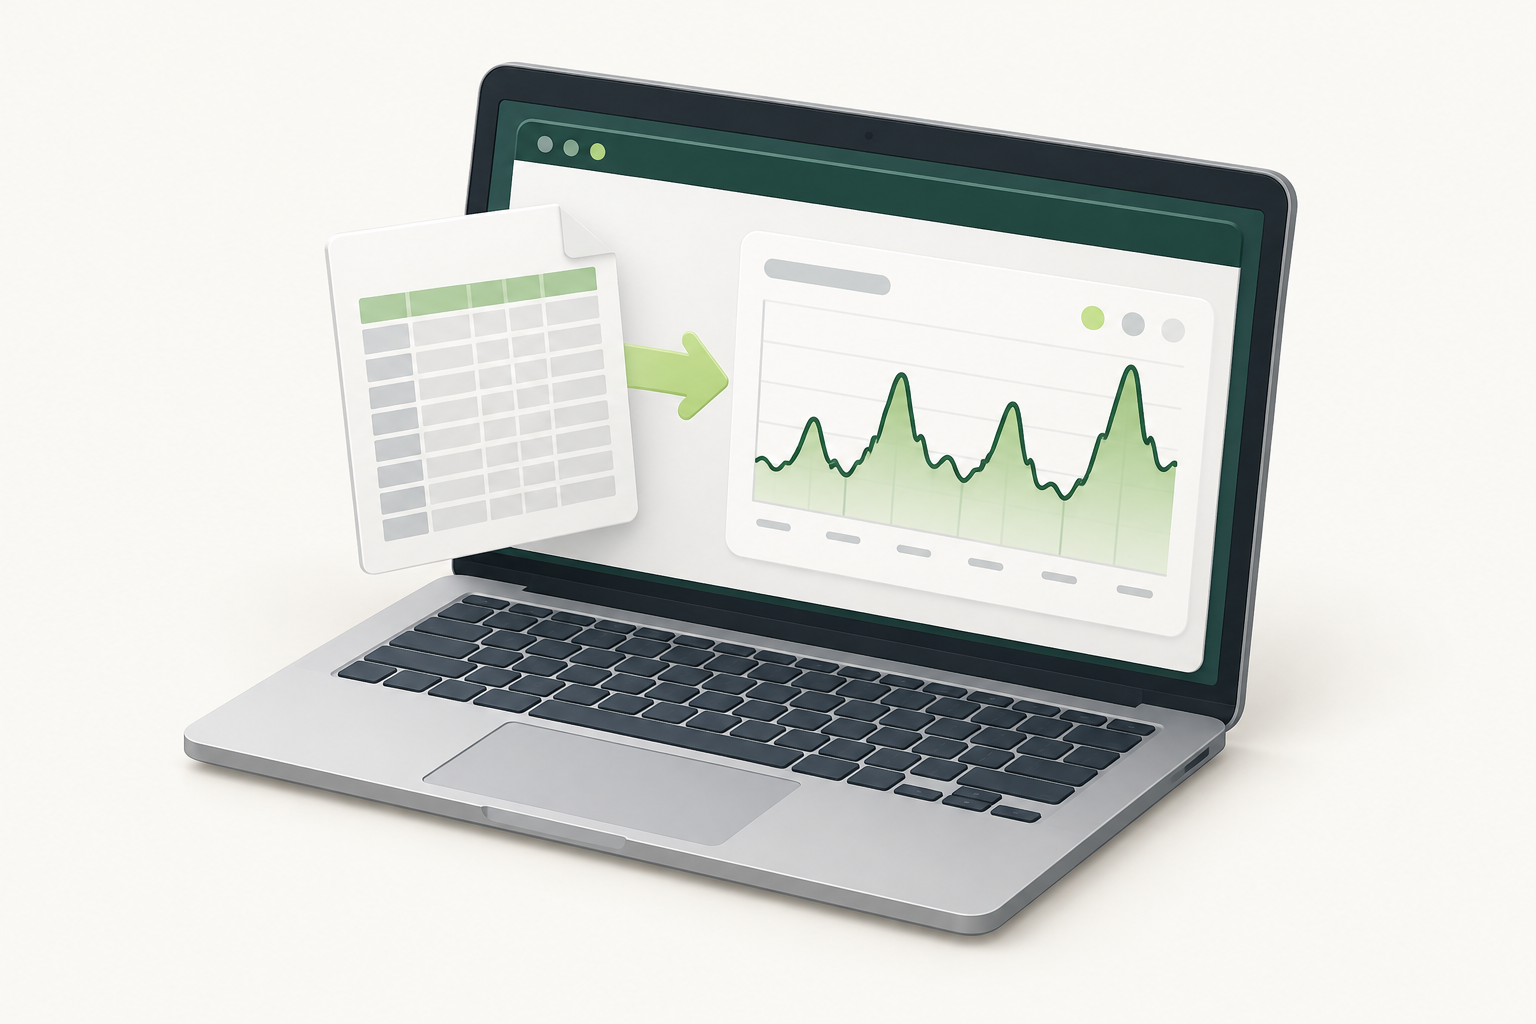
The app searches for time and measurements. Unclear information remains visible and is specifically requested.
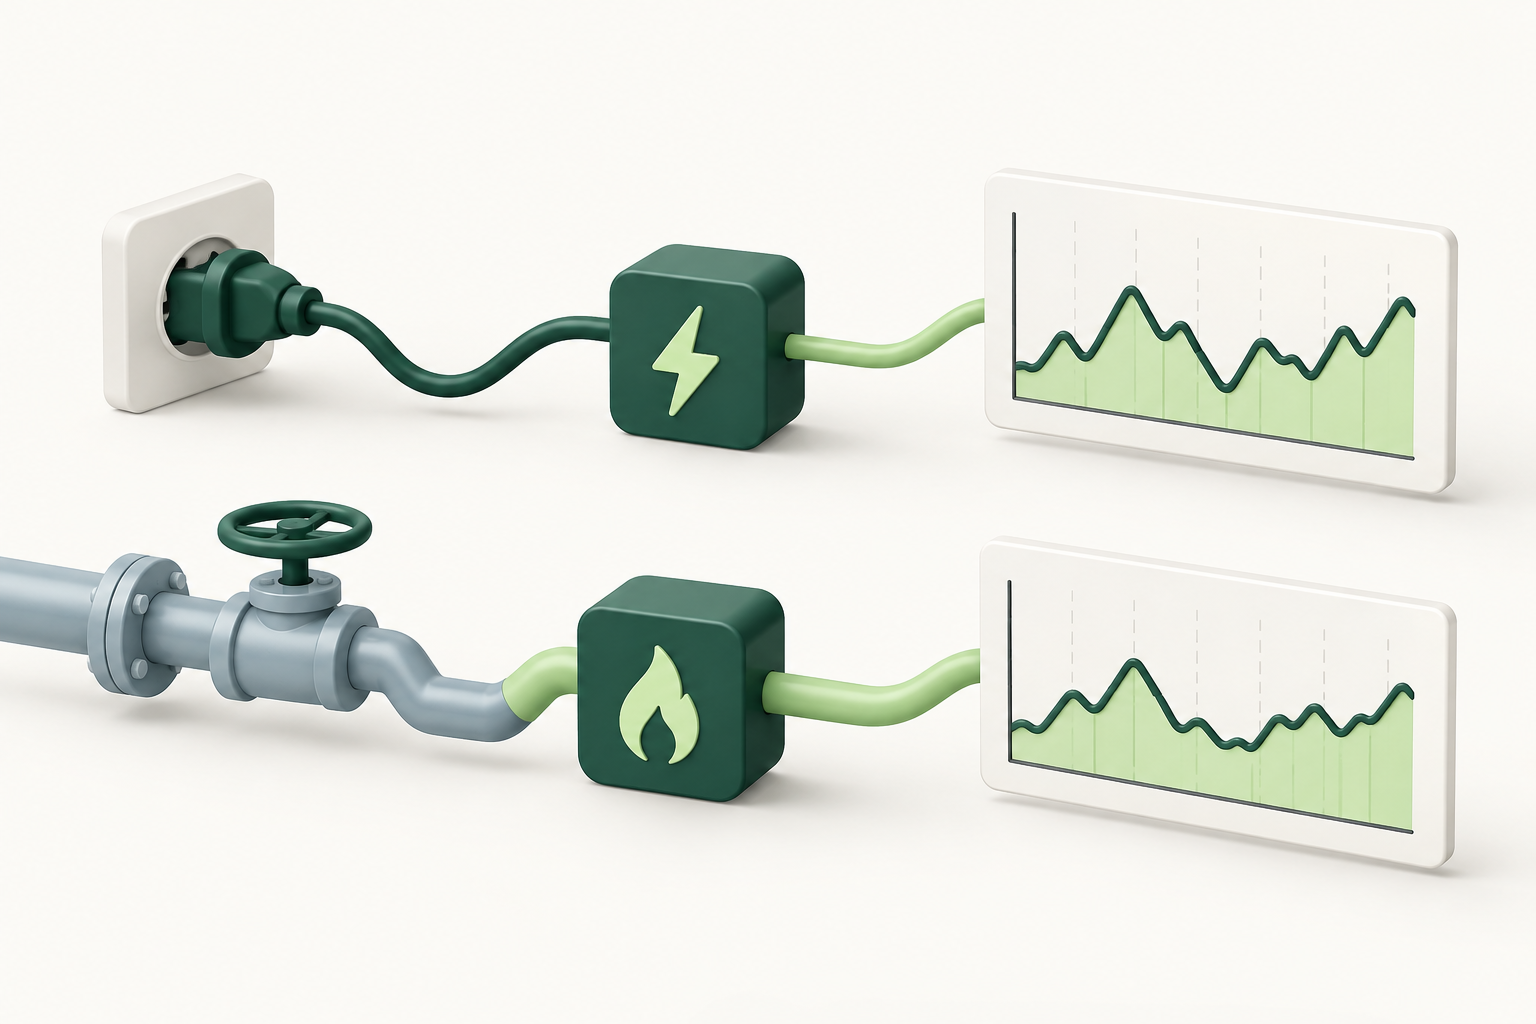
Same unit does not mean same energy source. Gas volume requires appropriate, verified conversion factors.
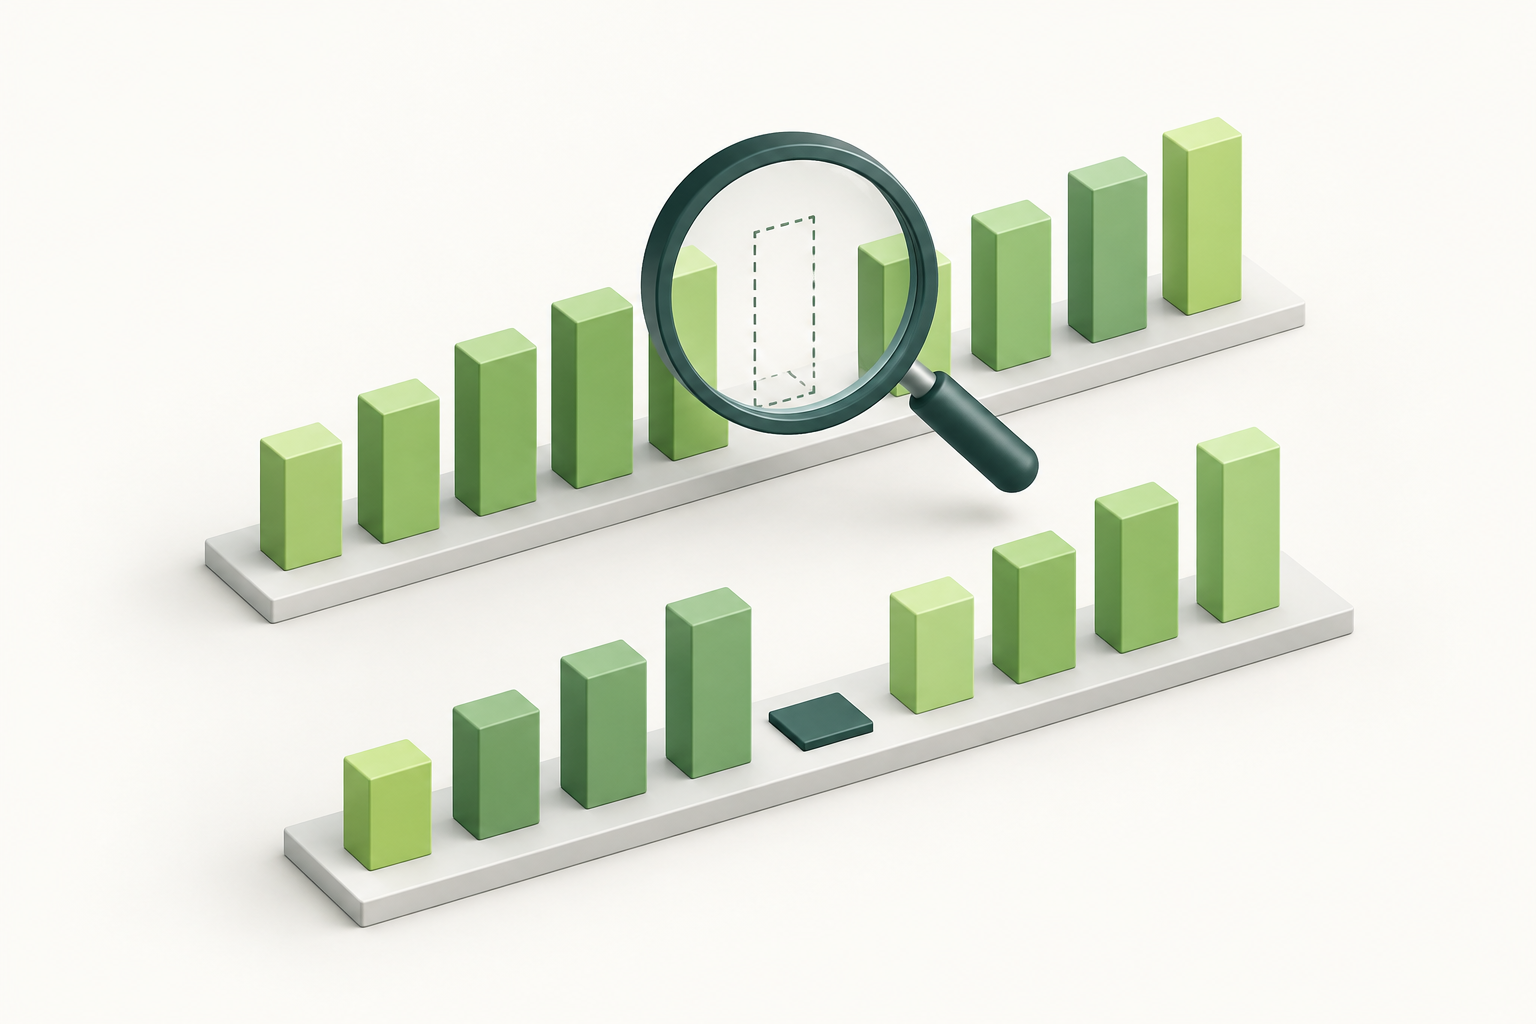
No measurement and measured standstill are different findings. Missing intervals are not automatically added.
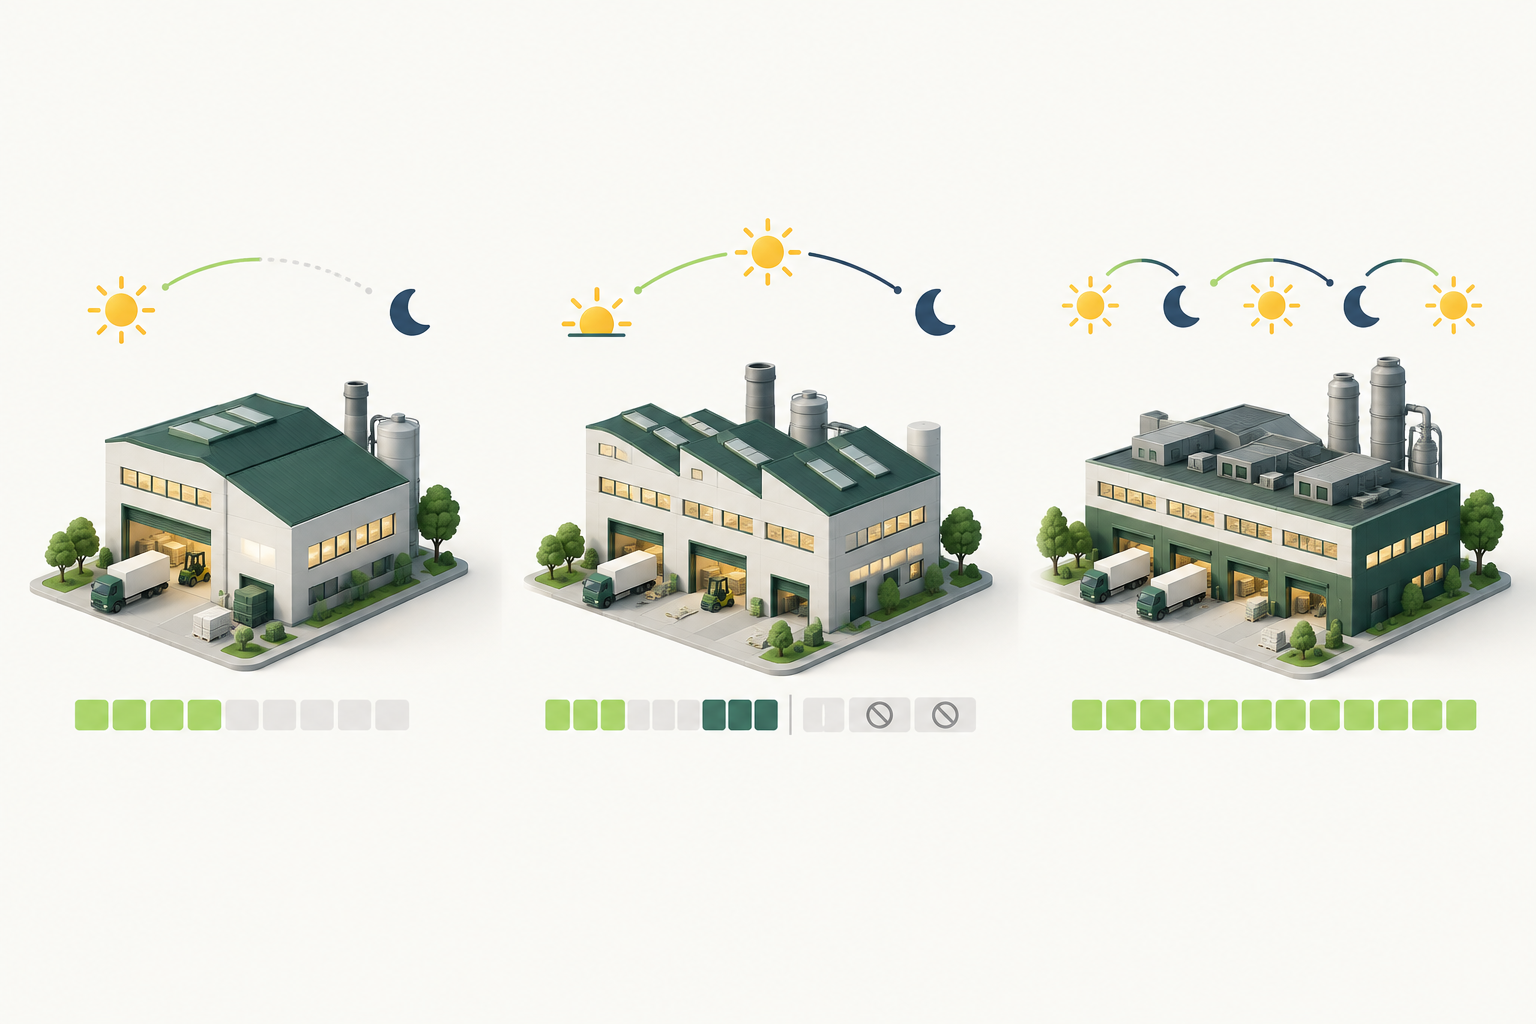
Three shifts with weekend breaks and continuous operation result in different patterns. Demonstrations make the difference tangible.
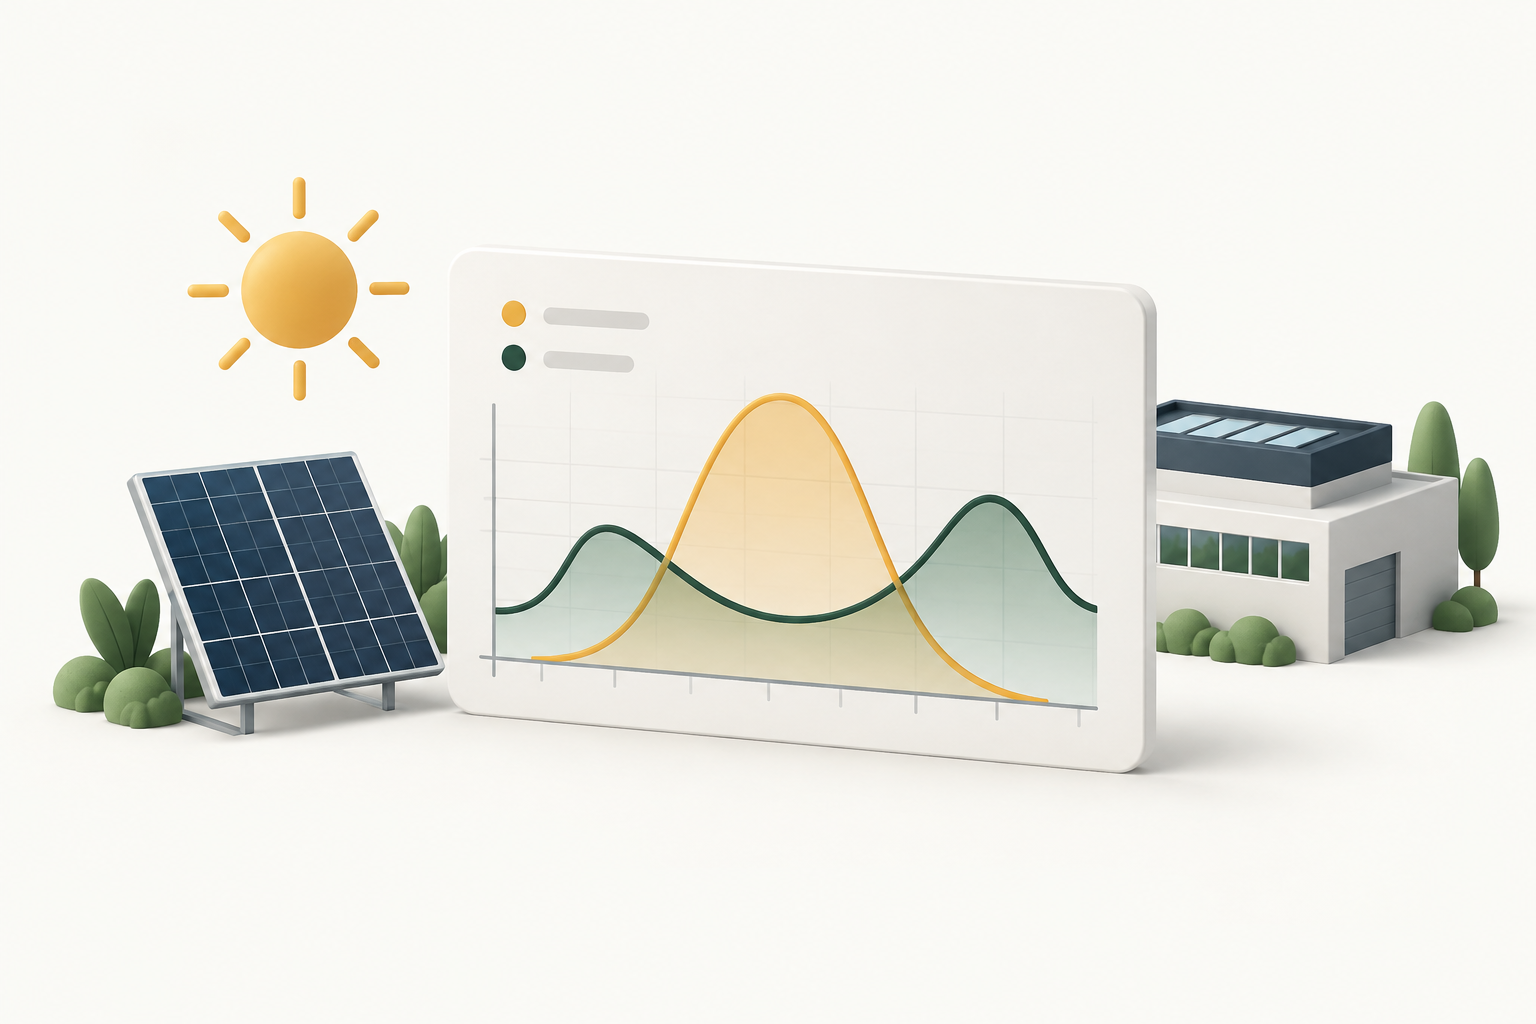
A grid load profile alone doesn't show how much electricity your PV system generates or how much of it you consume yourself. For that, you need time-aligned generation and metering data. Storage planning also requires factors such as usable capacity, charging and discharging power, and the planned operating model. The compass provides a data basis for this, but it doesn't offer a PV system comparison or automatic storage system sizing.
← Back to question overview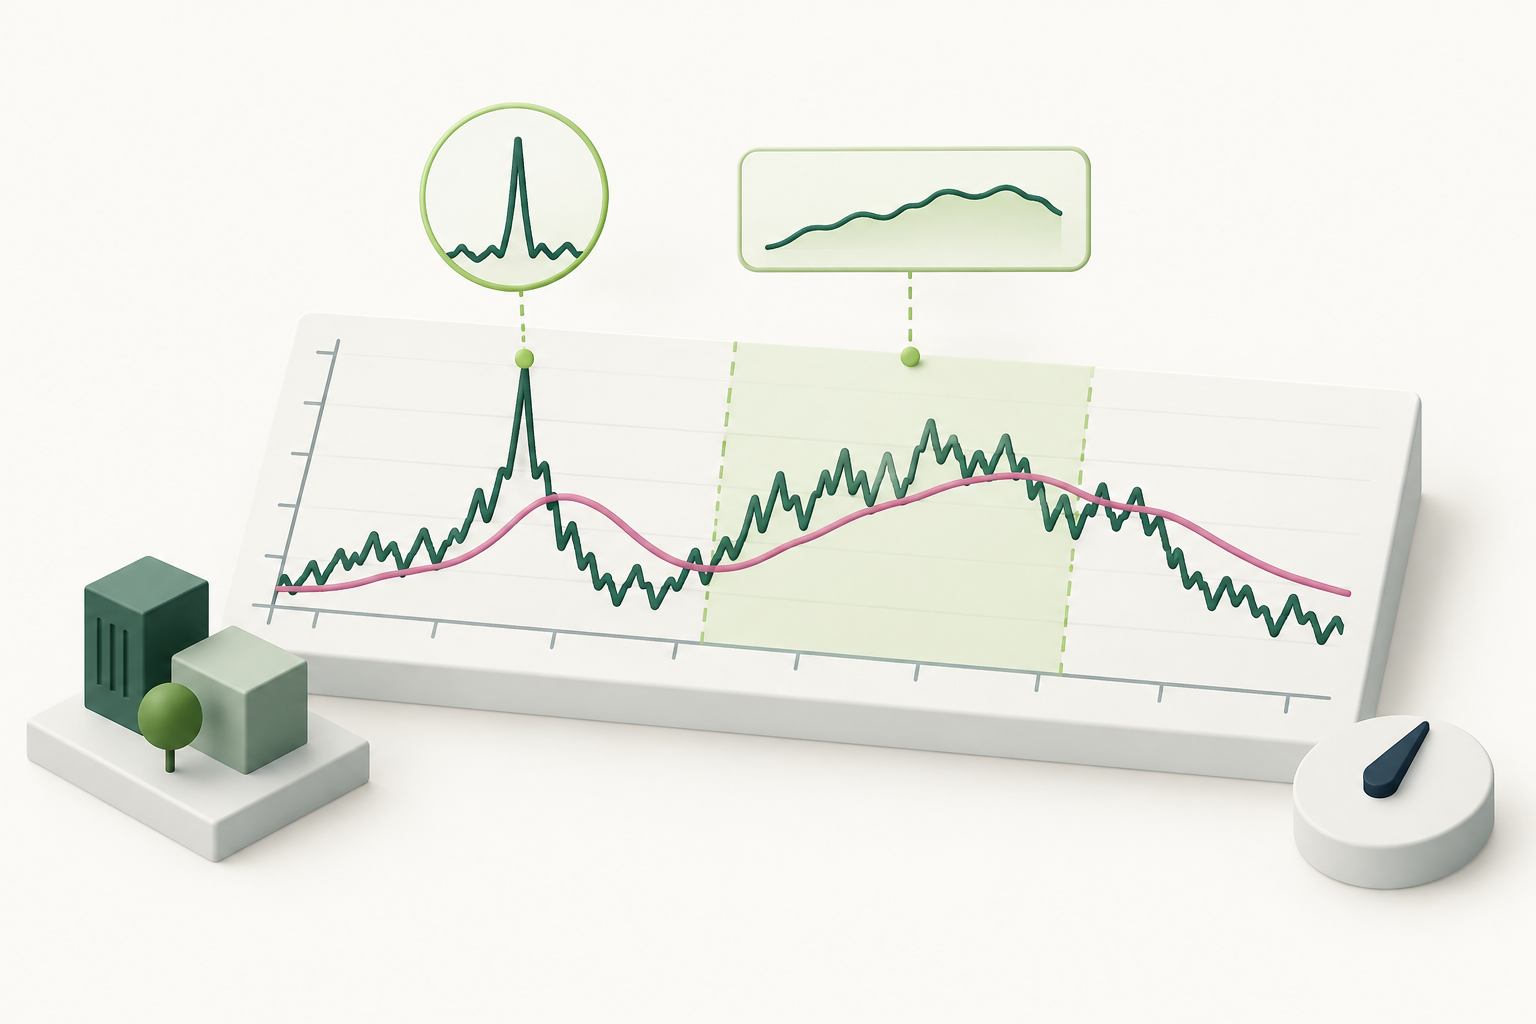
The 24-hour moving average shows a longer-lasting load. A brief peak remains visible in the original curve.

Save the OPTUM report locally and only send it after reviewing it yourself. A tool link does not contain any measurement data.
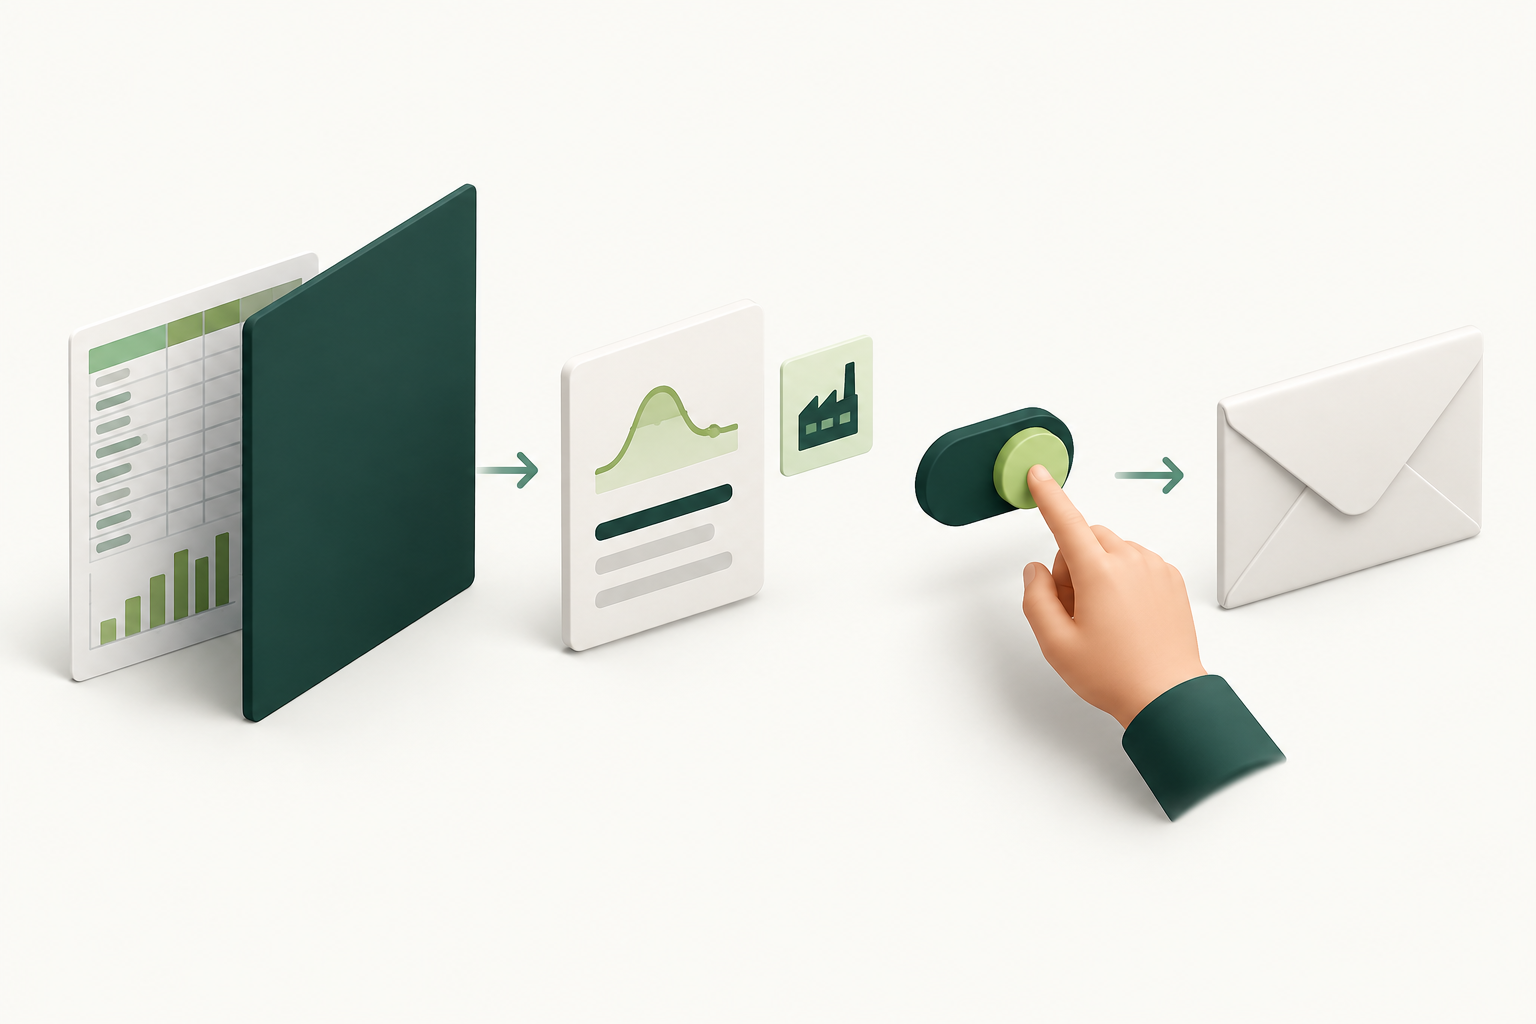
Optionally, absolute values and original data can be removed. Consumption patterns may still remain recognizable. You decide whether to share them.
The benefits for OPTUM clients
The free load profile compass makes your data understandable and prepares you for the important questions. Within the agreed OPTUM mandate, these findings can be evaluated together with contracts, invoices, and your operational plans. This way, individual key figures are transformed into priorities for your energy procurement.
An additional shift model, new machinery, or a planned shutdown can change future demand. Historical data helps to discuss such changes in detail and to establish assumptions for upcoming delivery periods.
Consumption times, quantity flexibility, contract duration, deadlines, and price components are all interconnected. The analysis helps prepare follow-up questions for suppliers and identify which conditions might be suitable for the business.
Management, purchasing, and engineering can discuss findings within the same timeframe. The agreed-upon review steps, information, and procurement deadlines are integrated into the personal support provided as part of the engagement.
Using the tool free of charge does not appoint OPTUM to act on your behalf. Personal services, scope and fees are agreed separately. No savings or specific procurement outcome are guaranteed.
OPTUM Energy Tools
We are making selected functions publicly available in compact browser versions. No registration required, with easy-to-understand calculation methods. The load profile compass is part of this offering; more tools are planned.
Analyze electricity and gas time series locally. Understand consumption patterns, peaks, and data quality.
Analyze your own file ↑Understand how gas volume becomes energy using gross calorific value and the volume conversion factor.
Go to the gas converter ↗Terms, procurement models and relationships for your energy purchasing explained in an easy-to-understand way.
Discover all content ↗Your thank you can help others
Did the load profile compass help you? If so, we'd appreciate it if you shared this free tool on LinkedIn as a small thank you and discussed it with your network. This will also give other companies the opportunity to better understand their energy consumption.
What surprised you about your load profile? What questions should companies ask their energy supplier? Share your thoughts – you don't need to publish sensitive consumption data.
Sharing is voluntary. Only the link to the tool will be shared, not your measurement data. Thank you for spreading energy transparency.
Questions about load profile analysis
Select your Excel or CSV file. The tool searches for date, time, and measurement columns, checks time intervals, and displays the identified mapping. Unclear units or time values will be prompted for clarification. You will then receive a load curve, key performance indicators, and a PDF report. The original file remains unchanged.
Average power in kW × interval in hours equals energy in kWh. Example: 100 kW over 15 minutes corresponds to 25 kWh. If your file already contains kWh per interval, this value must not be multiplied again by the interval length.
A consistently high power level outside of operating hours can indicate continuously running systems. A load peak shows the highest measured interval average, not the short-term inrush power. Both findings are indicators for further investigation: The load profile alone proves neither waste nor a specific cause. Cooling, IT systems, or ongoing production can also explain the pattern.
No. The app analyzes the measurement file you selected. It does not connect to your meter and does not replace missing values with a standard load profile. A load profile based on actual measurements describes your operation; a standard load profile is a calculated allocation for customer groups.
A load profile is a time series of measured power or energy. Unlike an annual bill, it shows when consumption occurs. Typical are 15-minute intervals for electricity and hourly values for gas.
Excel (.xlsx, .xls), CSV, TSV, and TXT files are supported, with one row per measurement interval and date/time. 15, 30, and 60-minute intervals, kW, kWh, and MWh are supported. Gas volumes per interval in m³ or Nm³, as well as average flow rates in m³/h or Nm³/h, can be converted using verified conversion factors. Cumulative meter readings and daily or monthly summaries require a separate export.
Exporting kWh data is the simplest method. For operating volume, the app requires the gross calorific value and volume conversion factor; for standard volume, only the gross calorific value is needed. The factors must be valid for the entire selected period. If the factors change, request a kWh export. The displayed power describes the energy flow of the gas, not the usable heating power. Daily views follow the calendar; separate gas-day-based billing is not included.
Gas billing explained by DVGW ↗In the model, building heating has higher winter consumption and a summer baseload. Process heat follows operating hours Monday–Friday, 06:00–22:00. The continuous process also runs at night and on weekends; recorded residual consumption from 11–13 August represents modelled maintenance. Each of the three examples contains 8,760 one-hour intervals for 2025, including clock changes. These are learning models, not industry benchmarks.
For real gas data, energy quantity, operating or standard volume, timestamp, and gross calorific value are crucial. High winter load alone does not indicate poor efficiency: weather, building characteristics, and production volume are missing from the data. This app analyzes calendar days from 00:00 to 24:00. In the gas industry, a gas day is typically recorded from 06:00 to 06:00; without this reclassification, daily values are not directly comparable with gas-day-based billing.
DVGW: Gas billing and conversion ↗ · Gasunie: Gas Day 06–06 a.m. ↗This version analyzes gas consumption. The public spot price comparison and high/low tariff comparison apply exclusively to electricity. A gas price assessment requires its own index and contract basis and is not included here.
Standard analysis does not transmit any measurement data. The file, calculation, and PDF creation remain on your device. Only when you explicitly choose to share a report or development profile does this process leave your local system. Only when you specifically request public electricity prices are the necessary monthly identifiers requested. Measurement data is not transmitted in this case. Website links open separately.
With an individual calculation, your load profile helps the supplier plan demand and procurement according to delivery times. The consumption profile can thus influence the energy price, even with a fixed price. Annual quantity, market conditions, contract terms, and risk costs also play a role. The historical spot price comparison in the compass is not a binding delivery offer. The calculation example shows the time effect.
Yes. You can use the browser version without registration or engaging OPTUM. Individual review and support from OPTUM will be arranged separately. The automatically generated report does not constitute personal expert approval.
Technical text status: September 18, 2026 · Publisher: OPTUM GmbH, Energy Brokerage Agency · Contact & Legal Notice ↗
OPTUM’s own development: The individual programming, texts, and design are protected to the extent that the legal requirements are met and OPTUM holds the corresponding rights. All existing rights are reserved in this respect. General analytical concepts, mathematical methods, and functions as such are not thereby claimed exclusively.
You may use the provided browser version free of charge for your own private and business analyses. You may share your own analysis reports, including source, trademark, and usage information, via email or LinkedIn. No further license is granted to incorporate protected OPTUM components into third-party products, copies, or clones. Statutory usage rights remain unaffected.
External libraries and public data are subject to their own licenses: SheetJS (Apache 2.0), pdf-lib (MIT), SMARD data (CC BY 4.0). OPTUM Usage Notice · Third-party providers and licenses
The OPTUM Load Profile Compass is a free, automated information tool. Its use does not constitute a consulting mandate. Results are for guidance only and are not binding procurement, investment, or operational recommendations.
The analysis is based on your locally selected file and your settings. OPTUM does not verify its original measurement accuracy, completeness, or billing correctness. Public price and generation data may originate from the Federal Network Agency / SMARD.de. This data may be preliminary, incomplete, or subsequently corrected. Calculations and presentations are performed by OPTUM; SMARD does not endorse this evaluation.
No warranty: No warranty is given for the accuracy, completeness, and timeliness of the input data, public data, and results, to the extent permitted by law. No guarantees of quality or success are given. Verify decision-relevant results using original documents and expert advice.
Liability for intent, gross negligence, and damages to life, body, or health, as well as other legally mandatory liability, is neither excluded nor limited. Rights and obligations arising from a separate OPTUM contract remain unaffected.
Source of public market data: Federal Network Agency | SMARD.de, CC BY 4.0. Processing by OPTUM: time allocation, aggregation, unit conversion and graphical representation; for electricity prices, consumption weighting is also included. Data status and coverage are shown in the evaluation.
Privacy Policy · Legal Notice · Last updated: September 18, 2026
Matching your evaluation
The articles will open in a new tab. The compass and an ongoing analysis will remain open here.
Understand timestamps, units, and gaps before evaluating results.
Find out when measured power matters for your bill.
Link measured values with production times, shifts and downtime.
Compare fixed prices, tranches and flexible models based on predictability and risk.
Combine load profiles, billing information, and contract documents into a reliable inquiry.
Hasan Sahin and the energy team will discuss any anomalies, contract terms, and your next procurement step with you. Please have the report, invoice, and contract ready. Your measurement data will not be transmitted automatically.
OPTUM in the community