
Does the file belong to the correct delivery point?
Still waiting for the file? Use the data request guide in the Load Profile Compass. Request the data for each delivery point with a clearly defined period, and mark any outstanding documents in your site list.
The CSV file is there, the graph looks plausible – but does it actually show your company's electricity import? Start with the basic data: delivery point, measurement direction, time period under consideration, and data source. Grid import is the electricity drawn from the public grid. Feed-in flows in the opposite direction; a submeter only records only a sub-area. If multiple files are involved, this mapping must be clearly defined before merging.
Keep the original file you received and edit a working copy. Note which columns were renamed, values converted, or time entries changed. This way, any unusual results can be traced back to the source. If a number later stands out, you can quickly determine whether it was already in the source file or only appeared during import.

Do not confuse kW and kWh
kW describes power, kWh a quantity of energy. If a quarter-hour series contains the average power in kW, the energy for the interval is calculated by multiplying by 0.25 hours. If the file already contains kWh per interval, this factor must not be applied again.

This example applies to a 15-minute average, not to any arbitrary instantaneous measurement point. Therefore, please check the export description. The sum of power values without a time factor does not represent an annual energy quantity.
The timeline needs a clear reference point.
Clarify whether a timestamp indicates the beginning or end of the interval and which time zone is used. In German local time, a normal day has 96 quarter hours. At the start of daylight saving time, there are 92, and at the end of the daylight saving time, there are 100. A file with these discrepancies is therefore not automatically incorrect. However, for times given in UTC, Coordinated Universal Time, the clock is not adjusted for daylight saving time.
- Order: Are timestamps sorted?
- Spacing: Does the interval correspond to the specified measuring grid?
- Duplicate lines: Are these true duplicates or explainable time references?
- Period: Are the beginning, end, or entire days missing?
If anything is unclear, ask the data provider for the export description. Do not automatically remove apparently duplicated times. Otherwise, valid measurements may be lost.
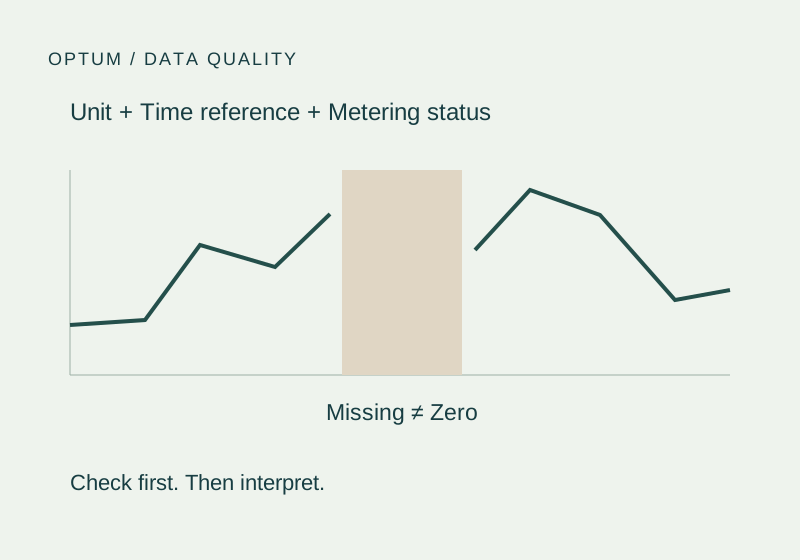
Missing values are not zero
An empty cell initially indicates that a value is missing. Zero, on the other hand, represents a concrete measurement. Even estimated or preliminary data should remain identifiable if the source provides a corresponding status. If gaps are filled for a model calculation, document the method and scope.
Measured, estimated, and missing are three different states. Show data gaps in the chart as well, instead of obscuring them with a seemingly continuous line.
Read the data status: measured, substituted, missing or genuinely zero?
The four cases help you check your file. They are not standardized export codes. The status legend and the export description from the data-providing entity are decisive. A filled numerical cell alone does not prove a measurement.
| case | Meaning | Evidence in file and description | Specific question |
|---|---|---|---|
| Measured value | The value is based on a measurement. It can be read directly or calculated from read values. | The timestamp, unit, and direction of measurement are correct; the status and origin are explained. The number alone is not sufficient. | "What status information confirms the measurement? Is this value read or calculated, and from which measurement series does it originate?" |
| Replacement value | A calculated value replaces a missing or implausible original value. It is not a subsequently measured quantity. | The source indicates the replacement value. Affected intervals and explanations of the procedure are retained in the working copy. | "Which intervals were replaced, why, and using which method? Are there any corrected measurements available now?" |
| Missing | No usable data is available for an expected interval. Its energy quantity is unknown. | Empty cell, missing row, or missing/invalid value according to the legend; also check the beginning and end of the export period. | "Is the measurement missing, or just the export? Can you provide the affected intervals with status information?" |
| True zero | For the interval and the measurement direction under consideration, a zero value is confirmed in the specified measurement resolution. | Numerical zero with complete time reference; the source confirms a valid measurement and not a placeholder. Rounding and resolution are known. | "Is the 0 actually measured, rounded, or used as a placeholder? What resolution and status information apply?" |
Zero is a numerical value, not a quality status. A substitute value can also be 0. Furthermore, a zero value for grid import does not prove that no electricity was consumed anywhere in the business. Keep preliminary values under a separate status instead of silently assigning them to the measured or final substitute values.
If information is unclear, request the export again, including status columns and legend. Document the data status, affected intervals, and any queries and responses. A self-added model series remains separate from the unmodified source.
Check decimal and thousands separators when importing tables. If “12,5” is read as “125”, for example, the value becomes ten times too high. Such outliers can create an apparent peak load that never occurred in the business. Also compare the calculated energy quantity with a bill for the same period and the same metering boundary.
Checking load profile CSV files in Excel: a small example
Import the working copy via Data → From Text/CSV; depending on your Excel version, the command may be located under "Get Data". Check three settings before loading:
- Columns: A semicolon separates the fields here. The preview must show timestamp, power and status in separate columns.
- Numbers: This example uses a comma as the decimal separator. The power column must contain numbers; an empty cell stays empty.
- Time: First, save the original timestamp as text. In this example, it indicates the start of the interval in German winter time (UTC+01:00); each interval lasts exactly 15 minutes.
| Interval start | Average power | Status in the example | energy |
|---|---|---|---|
| 00:00 | 80.0 kW | Value available | 20 kWh |
| 00:15 | 84.0 kW | Value available | 21 kWh |
| 00:30 | 88.0 kW | Value available | 22 kWh |
| 00:45 | 92.0 kW | Value available | 23 kWh |
| 01:00 | 0.0 kW | Zero value present | 0 kWh |
| 01:15 | 100.0 kW | Value available | 25 kWh |
| 01:30 | 96.0 kW | Value available | 24 kWh |
| 01:45 | Missing | Empty source cell | Unknown |
Check result: 135 kWh for the seven available quarter-hours. That's 105 out of 120 minutes. The total energy consumption for the entire two-hour period remains unknown. The zero value is included in the data coverage; the empty cell is not.
Follow along with the CSV example and Excel calculation
The three source columns are in columns A to C, the header row is in row 1. The unit kW applies to column B. The last power field is intentionally empty. This is a small import example, not a universal template for measurement files.
Intervallbeginn;Leistung_kW;Status
2026-01-15T00:00:00+01:00;80,0;vorhanden
2026-01-15T00:15:00+01:00;84,0;vorhanden
2026-01-15T00:30:00+01:00;88,0;vorhanden
2026-01-15T00:45:00+01:00;92,0;vorhanden
2026-01-15T01:00:00+01:00;0,0;vorhanden
2026-01-15T01:15:00+01:00;100,0;vorhanden
2026-01-15T01:30:00+01:00;96,0;vorhanden
2026-01-15T01:45:00+01:00;;fehlend
For this 15-minute example in German Excel notation: In cell D2, enter =WENN(ISTZAHL(B2);B2*0,25;"") and copy it down to D9. =SUMME(D2:D9) yields the known subset of 135 kWh. =ANZAHL(B2:B9) must return 7, not 8. A sum alone will not detect the gap.
If the number types, interval, and gaps are correct, you can further analyze your file in the Load Profile Compass. Your measurement file will not be automatically transmitted to OPTUM.
What becomes possible after the data check
Only a properly assigned series allows for a meaningful view of base load, peak loads, and shift patterns. The article What your load profile reveals about operations further explains the interpretation. For inquiries, the List of documents for energy tenders is helpful.
Clarify your analysis needs with OPTUM: First, describe the delivery point, time period, and the objective of your analysis. Also, specify the source of the file and the unit of measurement in the column header. We will then discuss with you what information is still missing for your procurement question and how the data can be provided.