
OPTUM ENERGY TOOLS · PUBLIC MARKET DATA
How full are Germany’s gas storage facilities?
Current gas storage levels are a snapshot. Trends, gas flows and capacity put them into context.
- Free to use
- No registration
- Daily data
Germany’s gas reserve
58.42 %144.59 TWhout of 247.48 TWh working gas capacity
Schematic filling display. Read percentages and energy quantities together.
Loading the available data.
How much gas is stored?
The filling level shows the proportion. TWh show the energy actually stored.
View trends →More or less than last year?
Loading the comparison for the same calendar day.
Last year and earlier years →Are inventories rising or falling?
Loading reported daily flows.
Injection and withdrawal →Storage filling levels alone do not indicate gas prices or how long supplies will last. How to read the data
Data source: GIE AGSI+ · Processing and presentation: OPTUM
Sources & notes for this view
German storage aggregates reported to AGSI. Filling levels refer to reported working gas capacity; total geological space and cushion gas are not included in this denominator.
GIE · AGSI: underground gas storage (opens in a new tab)
Estimated values are labelled. Unreported values remain gaps. The gas day shown with the data timestamp is authoritative.
Contents
Inventory, capacity, filling level.
InventoryStored energy · TWh
CapacityWorking gas capacity · TWh
Filling levelRatio × 100 · %
Germany in the network
European gas storage comparison
Compare filling levels, stored energy and capacities on the same gas day. Explore the map, country cards and selected time series.
Data not loaded yet
Direct country comparison
C = confirmed · E = estimated · — = no comparable report. * Partial capacity coverage: select a country for details.
EU and Europe are not identical. Ukraine and the United Kingdom are shown separately and are not added to the EU aggregate. Storage size, data coverage and transport routes limit direct comparisons.
Compare filling levels over the year
Select a maximum of four countries to keep the chart readable.
Preparing the chart.
Open table of all country values
Country figures refer to reported capacities. A high filling level says nothing about the size of the storage system.
Data source: GIE AGSI+ · Processing and presentation: OPTUM
Sources & notes for this view
National storage aggregates from AGSI. The European context is capacity-weighted, not a simple average of national filling percentages.
GIE · AGSI: underground gas storage (opens in a new tab)
Estimated values are labelled. Unreported values remain gaps. The gas day shown with the data timestamp is authoritative.
The trend matters
Gas storage levels: year-on-year comparison
Compare developments with previous years. Matching the time of year reveals seasonal differences.
- Springafter the heating season
- Summerbuild reserves
- Autumncheck winter reserves
- Wintercover peak demand
Historical curves show what happened. They do not guarantee the next winter.
Choose comparison years
You can select several years. On a computer, hold Ctrl or ⌘ to select more.
Preparing the chart.
Comparison lines show reported values. Missing data remain visible; reference lines do not replace checks of facility-specific targets.
Data source: GIE AGSI+ · Processing and presentation: OPTUM
Sources & notes for this view
Reported AGSI time series. Percentages and energy quantities have different denominators and units. Seasonal comparisons and reference lines are explained in the methodology.
GIE · AGSI: underground gas storage (opens in a new tab)
Estimated values are labelled. Unreported values remain gaps. The gas day shown with the data timestamp is authoritative.
What flows in and out
Is gas being stored or withdrawn?
Daily gas flows show how inventories move. Net flow makes the direction clear at a glance.
Gas enters storage. Gas enters the grid.
InjectionGas is added
StorageInventory as a stock
WithdrawalGas is released
Preparing the chart.
Injection and withdrawal are daily flows. Their difference does not necessarily equal the reported change in stocks.
Data source: GIE AGSI+ · Processing and presentation: OPTUM
Sources & notes for this view
Daily injection and withdrawal reported to AGSI, expressed as energy per gas day. Later reports and different accounting boundaries can explain differences from inventory changes.
GIE · AGSI: underground gas storage (opens in a new tab)
Estimated values are labelled. Unreported values remain gaps. The gas day shown with the data timestamp is authoritative.
Behind the average
Every storage facility has its role.
Large facilities influence the total more than small ones. Explore individual facilities and operators to understand the differences.
Same percentage. Different energy quantity.
Small store2 TWh capacity
50% · 1 TWh inventory
Large store10 TWh capacity
50% · 5 TWh inventory
Which stores have low filling levels – and where is the most space unfilled?
Percentage and size belong together. We compare reported units on the same gas day: the lowest levels on the left, the largest unfilled working gas space on the right. A report can describe only part of a site; it does not establish its total physical deliverability.
Data not loaded yet
Explore facilities and operatorsSearch, comparison, capacities and locations
Data not loaded yet
How is capacity distributed?
Where are the storage facilities?
Explore by operator
Data source: GIE AGSI+ · Processing and presentation: OPTUM
Sources & notes for this view
Facility and operator data from AGSI. Aggregates and individual facilities must not be counted twice. Only verified locations are shown on maps.
GIE · AGSI: underground gas storage (opens in a new tab)
Estimated values are labelled. Unreported values remain gaps. The gas day shown with the data timestamp is authoritative.
Another perspective
How does LNG supplement supply?
LNG terminals bring additional gas into the grid. Their tank inventories and gas flows are shown separately from underground storage.
Liquid LNG becomes gas for the grid.
LNG tankLiquefied natural gas
RegasificationReturn to gaseous form
Gas gridDelivery to the grid
Preparing the chart.
LNG tanks are not underground gas storage facilities. These figures are not added to Germany’s AGSI storage level.
Data source: GIE ALSI · Processing and presentation: OPTUM
Sources & notes for this view
LNG inventories and send-out data from ALSI. Energy values are converted only where reliable units are available. LNG and underground storage remain separate.
GIE · ALSI: LNG infrastructure (opens in a new tab)
Estimated values are labelled. Unreported values remain gaps. The gas day shown with the data timestamp is authoritative.
The meaning behind the figures
What gas storage levels really tell us
High storage levels create reserves. The resilience of gas supply depends on inventories, deliverability, ongoing imports and consumption together. The OPTUM gas storage monitor helps you understand these relationships through inventories, trends and an explanation of statutory requirements.
Connection 1 / 3
Read inventories correctly
Inventory and deliverability are different questions: how much gas is stored, and how quickly can it enter the grid? Ongoing imports and consumption also matter.
Simplified illustration · no measured data
Inventory is a stock. Gas flows change it.
The filling level shows stored gas. Injection adds gas; withdrawal releases it to the grid.
InjectionGas is added
Gas held in storageInventory in TWh
WithdrawalGas enters the grid
Inventory, supply duration and deliverability in detail
Storage levels are a snapshot
Gas storage is part of an ongoing supply system. While gas is withdrawn, pipelines and LNG terminals continue delivering gas to the grid. Demand fluctuates: a cold week places different demands on supply than a mild one, and industry and power stations also need gas.
Storage levels alone cannot tell us how long supplies will last. Dividing inventory by average daily consumption would conceal assumptions about future demand and further deliveries. Read inventories, changes and inflows together. Germany’s Federal Network Agency also assesses supply through this combination.
Inventory and deliverability belong together
Two stores can contain the same amount of gas yet deliver it at different rates. Inventory is the stored energy quantity. Withdrawal capacity is the quantity that can be delivered within a specified time.
The monitor uses different units: terawatt-hours (TWh) for inventory and gigawatt-hours per day (GWh/day) for daily gas flows. A large inventory alone tells us little about how much a facility can contribute at short notice.
Facility characteristics also matter. Operators publish, for example, performance curves that depend on filling levels. A published maximum rate is not a guarantee for every operating condition.
Sources & background
Checked on 2 October 2026
Connection 2 / 3
Compare and interpret
The same filling level does not mean the same gas quantity. Compare capacity, storage type and the same calendar day. Check statutory references for the individual facility.
Simplified illustration · no measured data
Same fill level. Different gas volumes.
The percentage relates stock to the respective working gas capacity. The energy volume in TWh makes differences in size visible.
Smaller storage facility
50 %Fewer TWh in storageLarger storage facility
50 %More TWh in storageBoth half full
Storage types, seasons and targets in detail
Different storage types operate underground
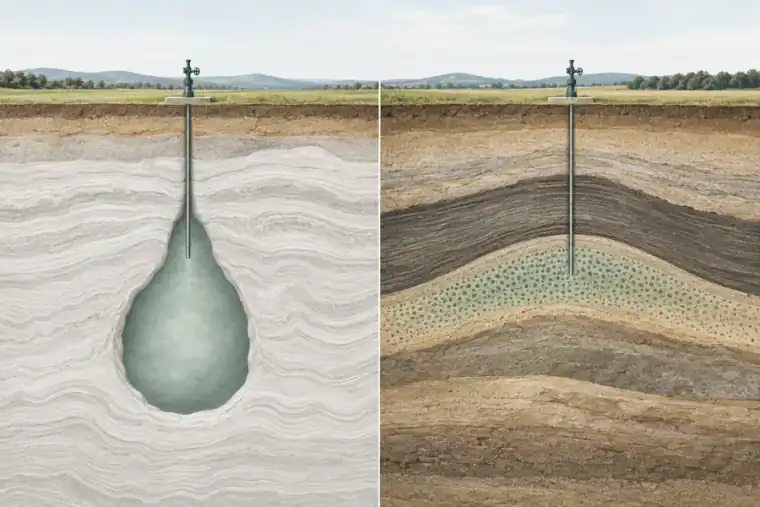
Porous storage uses spaces within rock, often former natural gas or oil fields. Gas spreads through fine pores. Cavern storage uses artificial cavities in salt formations. Geology and equipment shape how a facility can be used.
Harsefeld cavern storage illustrates short-term flexibility: its operator explicitly highlights high injection and withdrawal rates for balancing peak consumption.
When reading the data, consider size, storage type and output alongside filling levels. A lower percentage becomes meaningful only when these characteristics are considered.
Sources & background
Checked on 2 October 2026
The calendar changes what a number means
A given filling level in spring has a different meaning from the same level just before winter. Storage balances seasonal and weather-driven demand changes. Comparisons should therefore use the same point in the year wherever possible.
The previous-year curve and five-year range provide context. They show observations on comparable days, not a required minimum for the future.
Europe’s supply system is also changing. The European Commission documents, for example, LNG’s growing role in the import mix. Historical storage levels should therefore be read alongside today’s delivery routes and demand.
Sources & background
Checked on 2 October 2026
What the 80% line means
Germany’s storage filling regulation generally requires 80% per facility on 1 November. Bad Lauchstädt, Frankenthal, Hähnlein, Rehden, Stockstadt and Uelsen require 45%. On 1 February the general requirement is 30%; Bierwang, Breitbrunn, Inzenham-West and Wolfersberg require 40%. The regulation expires on 31 March 2027.
The 80% line in Germany’s chart references the November requirement for individual facilities. It is not a blanket statutory target for Germany’s total filling level. Compliance must be checked for the affected facilities.
The EU has different rules: its 90% baseline target applies to Member States’ relevant aggregate storage capacity and can be reached between 1 October and 1 December. Statutory flexibilities may also apply.
On 9 April 2026, the Commission reaffirmed its recommendation for the 2026 filling season to use existing flexibilities and consider reducing the target to 80% early in the season. This does not establish that any particular Member State has already applied a reduction. Distinguish the 90% baseline from a permissible deviation.
Sources & background
- German storage filling regulation – sections 1–3
- European Commission: gas storage
- Regulation (EU) 2025/1733
- European Commission: Gas Coordination Group – filling season 2026, 9 April 2026
Checked on 2 October 2026
Connection 3 / 3
Use the data for purchasing
A storage figure is not a buying signal. Delivery routes, weather, demand and your unhedged volumes also matter. Inventory can provide security but does not guarantee a price.
Simplified illustration · no measured data
What interacts in winter
Stock, ongoing deliveries and withdrawal capability work together. A single fill level therefore does not answer the supply question.
Cold weatherHeat demand can rise.
Import outageOngoing inflows can fall.
Demand and inflowsHigher demand can coincide with lower inflows.
Withdrawal capabilityHow quickly can gas move from storage into the network?
Market risks and purchasing terms in detail
Storage levels put gas purchasing into context
Storage data help track market conditions but do not identify a reliable buying time. Prices also depend on demand, weather, supply developments and the international LNG market. Commission gas market reports therefore consider several drivers together.
For a purchasing decision, combine the market overview with your consumption, delivery period and offer terms. Check which price components a price guarantee actually covers: its duration and scope may be limited.
The monitor supports preparation. It does not justify a conclusion such as “storage is well filled, so gas will get cheaper”.
Sources & background
Checked on 2 October 2026
Responsible for content: Hasan Sahin.
How we read the data
Sources are GIE AGSI+ for gas storage and GIE ALSI for LNG. These rules explain the basis of the display and comparisons.
Read data timestamps, statuses and comparison rules
- Gas day and data timestamp
-
In Germany, the gas day runs from 06:00 to 06:00 the next day in local time: 05:00 UTC in winter and 04:00 UTC in summer. The displayed date marks its start; inventory refers to its end. Retrieval time and gas day remain separate.
Sources & background
Checked on 2 October 2026
- Working gas and capacity
-
Filling levels refer to usable working gas, excluding cushion gas. Values above 100% are retained because firm capacity and physical possibilities may differ.
Sources & background
- Federal Network Agency: filling levels and working gas
- Federal Network Agency: filling levels above 100 percent
Checked on 2 October 2026
- Confirmed, estimated or missing
-
C means confirmed data, E estimated data and N no data. Missing values are gaps, not zero. Later reports can change earlier figures.
Sources & background
Checked on 2 October 2026
- Previous year and five completed years
-
OPTUM compares the same calendar day. For 2026, the five-year comparison covers 2021–2025. The band shows the minimum and maximum, the middle line the arithmetic mean. Missing observations are omitted; n is the count actually available. On 29 February only real leap-day observations are compared; a missing previous-year value stays empty.
- Change and net storage flow
-
Daily filling-level change is the difference between consecutive gas days in percentage points. Net storage flow is injection minus withdrawal. Capacity changes or corrections can cause the two measures not to match exactly.
Sources & background
Checked on 2 October 2026
- Limits of comparisons
-
Group composition, operators, capacities and historical coverage can change. Historical comparisons are descriptive OPTUM analyses, not supply-duration calculations, price forecasts or official findings of security of supply.
Sources & background
Checked on 2 October 2026
- Compare Germany and the EU correctly
-
German deadlines apply to each affected facility. The 80% line in the national chart is only a reference. EU targets apply to Member States with different boundaries and conditional flexibilities. A geographical total does not automatically establish legal compliance.
Sources & background
Checked on 2 October 2026
- Source and reuse
-
Data: GIE AGSI+ and GIE ALSI. Presentation and historical comparisons: OPTUM. Retain attribution when reusing. Primary sources were checked on 2 October 2026.
Frequently asked questions
Key answers on filling levels, units and interpretation.
What does a 100% filling level mean?
It refers to reported working gas capacity. Cushion gas remaining in storage is excluded from the calculation.
Sources & background
Checked on 2 October 2026
How can values above 100% be displayed?
Declared firm capacity does not always capture every physical possibility. Calorific value, filling behaviour and geology can allow additional injection.
Sources & background
Checked on 2 October 2026
Are these live figures?
Underlying AGSI values are published daily. The displayed gas-day date marks the beginning of the period; inventories refer to its end. Later corrections are possible.
Why are percentages and percentage points different?
A rise from 50% to 51% is one percentage point. The relative increase in this example is two percent.
Does the 80% line show an acute shortage?
No. It represents a November requirement for facilities. The Federal Network Agency considers imports, infrastructure, demand and other factors when assessing supply.
Sources & background
Checked on 2 October 2026
Can I infer when to buy gas?
Not from storage levels alone. Use them as a reason to review market information and offers. Your delivery period and contract terms remain essential.
Sources & background
Checked on 2 October 2026
Where can I find a table of current European gas storage levels?
The Europe section contains an expandable country table with filling level, energy in TWh, capacity, gas day and reporting status. The map and country cards use the same comparison day. EU and Europe are separate; incomplete capacity coverage is flagged.
How long will Germany’s gas stores last?
Storage levels alone cannot yield a reliable number of remaining days. Imports continue, demand changes and withdrawal rates are limited. Such a calculation must combine these factors with explicit assumptions.
Sources & background
Checked on 2 October 2026
At what filling level does supply become critical?
No universal percentage alone proves a gas shortage. Deliveries, demand, storage output and transport routes matter. Statutory filling requirements are deadline rules, not automatic crisis thresholds.
Sources & background
Checked on 2 October 2026
OPTUM ENERGY TOOLS
Understand. Compare. Decide better prepared.
Plan gas procurement
Connect market data with consumption, supply sites and contract terms.
Understand business gas →Load Profile Compass
Analyse electricity or gas consumption locally in your browser.
Understand your load profile →Gas converter
Convert cubic metres into kilowatt-hours using calorific value and conversion factor.
Convert gas consumption →Knowledge & tools
Understand terms and models for your energy purchasing.
Discover more →Developed by OPTUM · Rights & use
Software and presentation: OPTUM GmbH. Data: GIE AGSI+ / ALSI; maps: Natural Earth (public domain). Free use does not create a mandate. Data may be corrected retrospectively. Retain attribution when reusing. Editorial reference date: 2 October 2026.