
OPTUM / scenario analysis · gas supply
A contribution for German Unity Day · 3 October 2026
A quarter less gas in storage. The margin for error is shrinking.
48.20 TWh less in reserve than a year ago. A winter like 2024/25 would require additional cover. This can put purchasing under pressure — long before gas actually runs short.
Go to the gas storage monitor →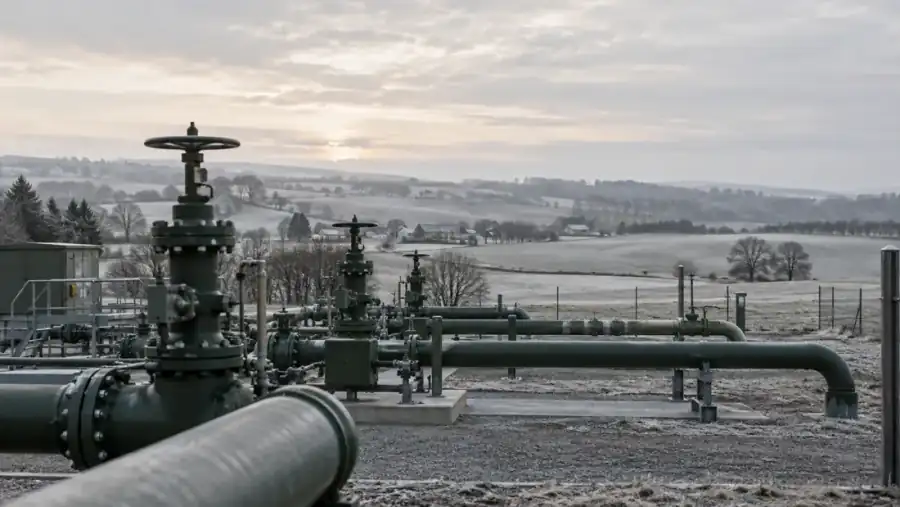
Stocks on 30 September
−25,14 %
Less in reserve · compared with 2025 −48,20 TWhBars start at zero · GIE AGSI · same-date comparison. Image: AI illustration.Stock data: GIE AGSI+, gas day 30.09.2026, retrieved 02.10.2026. The third figure is our own conditional balance calculation, not a measured future stock. The monitor may show newer reports.
How large is the buffer?
Stocks, actual consumption and historical winter paths show how much room remains.
Stock on the same date is 48,20 TWh lower than in 2025: a decline of 25,14 percent. Consumption from January to August 2026 was 1,76 percent higher. The Bundesnetzagentur currently rates supply as stable.
Reported stock · same reference date
48,20 TWh less in storage.
On 30 September 2026, storage held a quarter less gas than on the same day a year earlier.
- 30 September 2025
- 191,69 TWh gas stock
- 30 September 2026
- 143,49 TWh gas stock
Net withdrawals like 2024/25 would require 26,63 TWh of additional cover beyond the opening stock. Replaying 2025/26 would leave only 2,40 TWh at one point in February. This is a conditional calculation, not a reported supply gap.
Conditional calculation · not a reported supply shortage
This winter path exceeds today’s stock.
If net withdrawals from 2024/25 repeat, 26,63 TWh of additional cover is needed beyond the opening stock.
- Net withdrawals in reference winter 2024/25
- 170,13 TWh
- Of this, not included in the opening stock
- 26,63 TWh
These 26,63 TWh are not included in the reported opening stock. Timely additional inflows or lower consumption would have to balance the calculation. Any remaining safety buffer would be extra.
Winter consumption was 674,7 TWh in 2020/21 and 602,6 TWh in 2025/26: a difference of 72,1 TWh. The load on storage also depends on ongoing deliveries.
Simplified illustration · no measured data
What interacts in winter
Stock, ongoing deliveries and withdrawal capability work together. A single fill level therefore does not answer the supply question.
A winter that is mild on average can include individual freezing weeks. Unexpected cold increases short-term procurement pressure. Historical forecast errors do not provide a reliable error rate for Germany in 2026/27.
Concept graphic · not a temperature measurement series
A mild winter can include cold weeks.
Seasonal averages, individual cold spells and gas demand describe different things. A weather forecast cannot replace a volume reserve.
A forecast error expressed as a percentage cannot be converted into the same increase in consumption. Region, temperature, duration and timing of the deviation matter — together with the deliveries available then. Unexpected cold can trigger additional purchases and price pressure.
Figures, context and sources for this section
Conditional calculation from 143,49 TWh on 30.09.2026 to the end of March 2027: historical net withdrawals are applied to the smaller opening stock. Additional net inflows or savings can improve the balance. On 02.10.2026, the Bundesnetzagentur rated supply as stable and the risk of shortages as low. A future price shock is a risk scenario, not an established outcome.
48,20 TWh less than a year ago
143,49 rather than 191,69 TWh. That was the working gas stored on 30.09.2026 and 30.09.2025 respectively. Using unrounded figures: (191,6921 − 143,4933) ÷ 191,6921 × 100 = 25,14 percent less gas. The fill level fell from 76,68 to 57,97 percent — a decline of 18,71 percentage points. GIE AGSI+, calculation by OPTUM.
Demand did not fall alongside it. January to August 2026 consumption was around 552,6 TWh, against 543,1 TWh in the same period a year earlier — up 1,76 percent. September is not yet fully available in this series. Bundesnetzagentur/THE, our sum of monthly figures.
On 2 October, the Bundesnetzagentur rated supply as stable but expected a comparatively low stock at the end of winter to be likely. Our conclusion: with a smaller reserve, ongoing deliveries and demand must match more reliably. Official assessment.
Check current storage figures for yourself: the gas storage monitor lets readers compare reported stocks and historical trends, alongside individual facility reports and the European comparison. This article uses the fixed reference date 30.09.2026. Consumption, weather and prices are supported by their respective primary sources.
Reported capacity fell only from 249,98 to 247,53 TWh. The substantial loss of gas therefore cannot be explained by a comparably large reduction in reported storage space. Compared with the end of September 2024, storage holds 97,70 TWh less.
The 25,14 percent refers neither to total storage capacity nor to annual consumption. For the same gas day, the EU reports 71,50 percent and 809,1 TWh, with estimated status. The European comparison supplements the German balance; an average cannot replace a review of transport routes.
An earlier winter used 72 TWh more
602,6 TWh in winter 2025/26, 674,7 TWh in winter 2020/21. The earlier period was around 72,1 TWh or almost twelve percent higher. This is observed demand, not an invented stress assumption. It does not predict a repeat. Bundesnetzagentur: current series; historical SLP and RLM figures.
Cold weather affects a large share of consumption. Households and smaller commercial customers accounted for 50,1 percent in January 2026 and 46,5 percent, or 280,2 TWh, over the winter. This includes more than space heating alone. Around 56 percent of homes are heated with gas, including biomethane and LPG. Bundesnetzagentur; BDEW 2024.
Consumption alone does not explain storage withdrawals. Total consumption in 2024/25 was 596,9 TWh, slightly below 2025/26. Yet storage supplied a net 170,13 rather than 137,51 TWh. Ongoing imports, exports and other balance factors also matter. Looking only at weather understates this dependence.
| Winter | Gas consumption · TWh | Compared with 2025/26 |
|---|---|---|
| 2018/19 | 633,4 | +30,8 TWh |
| 2019/20 | 630,7 | +28,2 TWh |
| 2020/21 | 674,7 | +72,1 TWh |
| 2024/25 | 596,9 | −5,7 TWh |
| 2025/26 | 602,6 | Reference baseline |
Source: Bundesnetzagentur/THE. Our sum of published monthly averages in GWh/day × actual calendar days ÷ 1.000. Values are approximate because the source figures are rounded. SLP is calculated from network data and can be revised; RLM also includes gas-fired power generation. This is not added to total consumption a second time.
The annual view also challenges an easy extrapolation: gas consumption was around 1.029 TWh in 2021 and around 864 TWh in 2025. An earlier, higher level cannot simply be treated as today’s requirement — production, savings and technology have changed. It does show why a higher-consumption scenario deserves examination.
Cold weather can raise demand quickly. Total consumption in January 2026 was around 136,0 TWh, ten percent above January 2025. Heating can be managed more efficiently, but a cold building cannot wait months for a cheaper delivery date. We do not attribute the whole increase in consumption to weather alone.
Four historical winters would require more gas
We apply documented net withdrawals to the opening stock for 2026. Calculation: 143,4933 TWh minus historical withdrawals plus historical injections, in each case from October to March. The table shows the results of this conditional winter balance.
Even the last winter would leave little room. Net withdrawals in 2025/26 were 137,51 TWh: 158,70 TWh withdrawn minus 21,19 TWh injected. With today’s opening figure, 5,98 TWh would remain at the end of March, falling temporarily to just 2,40 TWh in the replayed February path. A positive balance does not prove adequate daily delivery capacity.
Withdrawals like 2024/25 exceed the opening stock by 26,63 TWh. This additional volume is not in storage at the reference date. In the model, it would have to be covered in time by higher net inflows or lower consumption. This says nothing about supply contracts already in place. Once the calculation falls below zero, a real adjustment is needed.
2017/18 would require as much as 29,62 TWh of additional cover by the end of March; 2016/17 and 2020/21 would also require more than is available. With the lower withdrawals of 2023/24, 66,25 TWh would remain. The historical paths show a range of outcomes, not probabilities.
| Historical net withdrawals as in winter | Net withdrawals · TWh | End-of-March result · TWh | Most critical interim balance · TWh |
|---|---|---|---|
| 2025/26 | 137,51 | 5,98 remaining | 2,40 minimum remainder |
| 2024/25 | 170,13 | 26,63 additional cover required | 26,63 maximum additional cover required |
| 2017/18 | 173,11 | 29,62 additional cover required | 29,72 maximum additional cover required |
| 2016/17 | 166,31 | 22,82 additional cover required | 28,42 maximum additional cover required |
| 2020/21 | 166,86 | 23,37 additional cover required | 25,82 maximum additional cover required |
| 2023/24 | 77,24 | 66,25 remaining | 66,01 minimum remainder |
Our calculation from daily GIE reports. Net = gross withdrawals minus injections. “Additional cover required” denotes the requirement assuming complete mathematical use of the opening stock; any desired reserve buffer would be extra. 2016/17, 2017/18 and 2020/21: entirely estimated historical series. 2023/24: 183 rather than 182 reference days. The lowest interim balance can fall below the closing balance. No network or price forecasting model.
The unrounded calculation for 2025/26 is: 143,4933 − 137,50965 = 5,98365 TWh, around 2,4 percent of today’s working gas capacity. Later injections lift the closing balance above the temporary minimum. 2024/25: 170,13 TWh net withdrawals. 2020/21: 23,37 TWh additional requirement at the season’s end, temporarily 25,82 TWh; 2017/18 temporarily 29,72 TWh; 2016/17 temporarily 28,42 TWh. The closing balance and the most critical point are therefore shown separately.
Reported net withdrawals are not Germany’s total gas consumption: ongoing deliveries meet a large part of demand directly. The historical conditions are already included in the historical net withdrawals. Additional injection must therefore not be credited a second time. An improvement of 10 TWh in the winter balance raises the calculated remainder by 10 TWh; higher demand or lower net inflows reduce it accordingly.
Limits of the calculation: in winters 2025/26 and 2024/25, 29 and 22 daily reports respectively are estimated; the available data for 2016/17, 2017/18 and 2020/21 are entirely estimated and subsequently updated. Stock changes and reported flows do not match exactly because of revisions and capacity changes. The calculation therefore uses flow totals. A positive seasonal remainder does not demonstrate sufficient daily withdrawal or network capacity. It cannot establish a specific shutdown date.
The 2023/24 reference includes its extra leap day. Every 10 TWh improvement in the balance raises the calculated remainder by 10 TWh. Any desired reserve buffer would be additional to the extra requirement shown.
A mild winter is no guarantee against cold spells
Even a winter that is mild on average can have critically cold weeks. The DWD describes 2017/18 as a mild winter with freezing temperatures in late February. Replaying its net withdrawals would temporarily require 29,72 TWh of additional cover. Weather was not the only cause. DWD: winter 2017/18.
Northern Europe in 2023/24 provides a documented forecast error. The ECMWF seasonal forecast expected warm anomalies in the area studied, but cold conditions dominated. A research study found three of 31 Fennoscandinavian periods that were colder than every ensemble run: 9,7 percent of this specific sample. This is not an error probability for Germany. ECMWF; FMI research paper.
We do not assign an unverified probability to Germany’s winter 2026/27. At the editorial cut-off on 3 October, we could not fully verify a current numerical German forecast; the regular ECMWF October run is only published on 5 October. Weather probabilities are not probabilities of a gas shortfall. A cold stress case therefore remains relevant to planning.
A clearly documented forecast error: Northern Europe, 2023/24. The ECMWF seasonal forecast of 1 October 2023 expected a positive temperature anomaly of over one degree for November to February in the studied area of Finland/northeastern Sweden. Cold anomalies dominated instead. ECMWF documents the deviation itself; shorter-lead forecasts captured some of the cold developments better. ECMWF assessment, April 2024.
How often was cold underestimated this severely? A study by the Finnish Meteorological Institute found three of 31 October–January periods in the studied ECMWF series for Fennoscandia when the observed temperature was below every ensemble run: 2002/03, 2010/11 and 2023/24. That is 9,7 percent of this specific sample. At the same time, 16 of the 31 observations fell within the central 50 percent of the model distribution — roughly as often as expected. FMI research paper, first published May 2024.
For the individual period October 2023 to January 2024, only three of 552 runs from eight forecasting systems were at least as cold as the subsequent observation: around 0,5 percent. This 0,5 percent is the model share for one case, not an error rate. Nor do three extreme deviations in 31 periods establish a general error probability for German winters. Region, lead time, ensemble size and the mix of historical hindcasts and contemporary real-time forecasts limit the comparison. Study dataset and methodology.
Forecasts are therefore not generally worthless: ECMWF rates its temperature forecast for Western and Central Europe in 2022/23 as good. Its current report from September 2026 nevertheless describes continental cold anomalies as a continuing challenge. ECMWF: winter 2022/23; ECMWF: current performance assessment. We could not verify a reliable blanket rate of “weather services are wrong X percent of the time” for Germany at this lead time.
What is supported for 2026/27? On 11.09.2026, the UK weather service described increased chances of a warm and wet British autumn/early winter. That is not a forecast for Germany’s December-to-February winter. We could not fully check a current numerical probability for Germany in the original DWD release, so no figure is used. The regular ECMWF October run is only published on 5 October, after our editorial cut-off. Met Office, September 2026; DWD climate forecasts; ECMWF publication schedule.
How does additional gas reach us?
A purchasable volume needs an available delivery route — and must reach the network in time.
Norway, the Netherlands and Belgium dominate Germany’s import routes. LNG arrives directly and via neighbours. These inflows already serve demand; they are not a freely available additional reserve.
Supply routes and global competition
Several supply routes. One connected market.
Pipeline gas and LNG reach Germany via different routes. A country of entry is not automatically the country of production.
Even an indirect supply route can transmit prices. An outage in the Gulf need not affect Germany directly to intensify competition for LNG.
26,63 TWh would equal around 12,1 weeks of Germany’s entire LNG inflow in the last week of September. Those ongoing deliveries are already needed. Additional gas requires available cargoes, transport and network access.
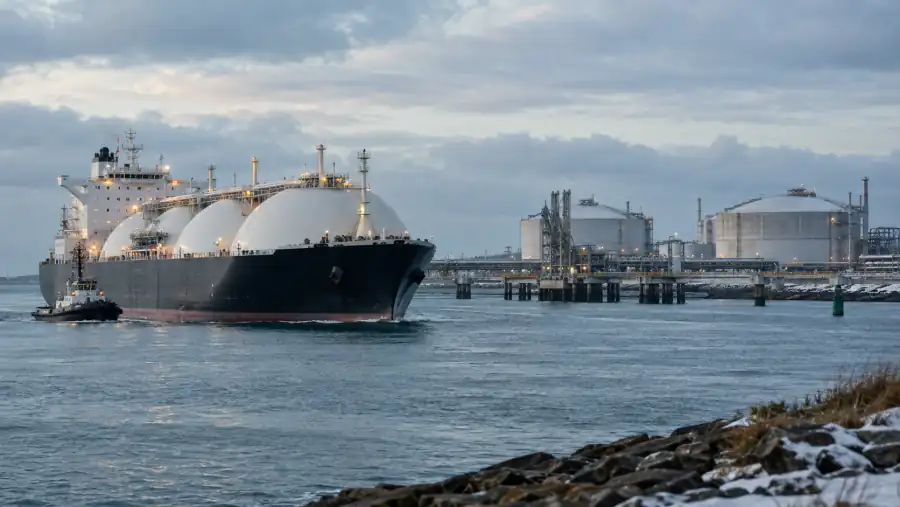
How an LNG cargo becomes usable gas
Ordered does not yet mean delivered.
Four stages must align. Only at the end does the additional volume reach the gas network.
-
1
Secure a cargo
An available cargo must match the required delivery date.
-
2
Transport by sea
LNG travels as a liquid in a tanker. The route determines the journey.
-
3
Regasify at the terminal
The liquefied gas is regasified and fed into the network.
-
4
Deliver to consumers
The gas network connects deliveries to buildings and businesses.
An order does not fill a storage facility. The volume must physically arrive in time.
Figures, context and sources for this section
Conditional calculation from 143,49 TWh on 30.09.2026 to the end of March 2027: historical net withdrawals are applied to the smaller opening stock. Additional net inflows or savings can improve the balance. On 02.10.2026, the Bundesnetzagentur rated supply as stable and the risk of shortages as low. A future price shock is a risk scenario, not an established outcome.
Where Germany gets its gas — and where dependencies remain
The latest full-year balance shows the structure: in 2025, 44 percent of German gas imports came from Norway, 24 percent via the Netherlands and 21 percent via Belgium. German LNG terminals contributed 10,3 percent. These are rounded shares of gross imports in 2025, not current daily shares for 2026. Bundesnetzagentur: 2025 annual review.
The country of entry does not always reveal the country of production. Some gas arriving via the Netherlands and Belgium is already regasified LNG. According to the current Bundesnetzagentur FAQ, Germany’s direct LNG imports are mainly from the USA; gas from the Persian Gulf plays no significant direct role. Bundesnetzagentur: supply routes.
A large supply share is not a reserve that can be called up at short notice. Imports from Norway and neighbouring countries already meet ongoing demand. Replacement requires additional available volumes and transport options. In the week from 24 to 30 September 2026, 15,1 TWh arrived by pipeline and 2,2 TWh via German LNG terminals. These actual deliveries are not an unbooked additional offer. Current weekly flows.
Our concern is several pressures occurring together: less gas in storage than a year ago, disrupted LNG deliveries, competition for replacement supply and cold weeks. Additional procurement could then become harder and more expensive at the same time. For an unhedged buyer, it is not enough that gas exists somewhere: they need a deliverable offer for their volume and date.
Norway · pipeline through the North Sea
Form and routeGas flows through Europipe I/II to Dornum and Norpipe to Emden, then onwards through the German network.
Possible riskProduction, processing and pipelines must work together. Maintenance or technical faults can limit available capacity.
Gassco: pipelines and receiving terminals →USA · LNG across the Atlantic
Form and routeNatural gas is liquefied, shipped to European terminals, regasified and fed into the network — directly in Germany or via neighbouring countries.
Possible riskLiquefaction plant, export port, sea transport and landing add stages. A storm can delay deliveries; flexible cargoes have other buyers worldwide.
EIA: documented storm effects in 2024 →Netherlands and Belgium · European network
Form and routeGaseous inflows with mixed origins, including Norwegian gas and previously landed LNG. A border crossing does not prove the country of production.
Possible riskTerminals, network capacity and demand from other European buyers determine the room for additional deliveries. An order alone cannot create more gas.
Bundesnetzagentur: German supply routes →Qatar and the Emirates · LNG through Hormuz
Form and routeLNG ships pass through the Strait of Hormuz. Germany is mainly affected through other buyers’ replacement purchases and European market prices.
Possible riskDisrupted production or passage can force buyers to seek alternatives. That increases competition for other cargoes and can raise their price.
IEA: route dependence and global market effects →Supply routes and possible disruption mechanisms, not a report of simultaneous current outages. The Bundesnetzagentur rates German supply as stable at the editorial cut-off. LNG is liquefied natural gas; after regasification, it flows through the network as gas.
Import structure 2025 · historical annual shares
Germany receives gas via several routes.
Norway and the western neighbours dominate the import structure. LNG enters the network via German terminals and indirectly via neighbouring countries.
- Norway · import share 2025
- 44 %
- Netherlands · import share 2025
- 24 %
- Belgium · import share 2025
- 21 %
- German LNG terminals · 2025
- 10,3 %
A country of entry is not automatically the country of production. LNG also reaches Germany through the Netherlands and Belgium. A supply route via Europe therefore does not shield buyers from the global market.
The Bundesnetzagentur points to additional LNG import options and currently rates supply as stable. A lower storage level alone therefore does not prove an overall more dangerous supply situation than in 2022. Our warning describes a conditional risk from several simultaneous pressures; it does not establish a probability of occurrence. Bundesnetzagentur: storage and the new import structure.
The 2025 annual balance reports 1.031 TWh of gross imports, 221 TWh of exports and 34 TWh of domestic production. Import shares are therefore not shares of German final consumption. Border flows also do not provide a complete origin record for individual gas volumes. Annual balance.
Predictable pipeline inflows and additional LNG infrastructure can cushion risks. They do not imply unlimited additional available volumes or a guaranteed price. National storage and import data do not show how much an individual buyer has already secured.
Storm risk has historical evidence: in July 2024, an LNG export plant in Texas halted operations as a precaution before Hurricane Beryl; all three liquefaction trains were back in service on 28 July. This illustrates a possible supply-chain interruption, not a current outage in October 2026. EIA, September 2024. The infrastructure risks in the other cards are checkpoints derived from the supply routes described, not outage forecasts.
Qatar and Hormuz: little direct supply, global price risk
Around 19 percent of global LNG trade passed through the Strait of Hormuz in 2025. This mainly refers to LNG from Qatar and the United Arab Emirates — not 19 percent of German gas imports. Almost 90 percent of the LNG passing through Hormuz went to Asia. If cargoes are lost, their buyers also seek replacements in Europe’s procurement markets. IEA: reference bases and trade routes.
Agreements with Gulf states matter — and so does their delivery status. During Olaf Scholz’s term, companies signed long-term contracts in 2022 for up to two million tonnes of Qatari LNG annually. The start originally planned for 2026 is now expected in 2027 according to the German government, because commissioning of the Brunsbüttel terminal was delayed. This contracted volume is therefore not evidence of deliveries already running in winter 2026/27. Contract announcement, 2022; Corrective government footnote, 2026.
An announcement of 28.09.2026 confirms extended outages of Qatari deliveries to Italy until early December: 35 cargoes totalling around 4,6 billion cubic metres. The importer also reports replacement procurement and its ability to fulfil customer contracts. This documents supply disruptions and replacement purchases; it does not establish a German supply gap. Primary announcement.
Price competition is documented. From March to June 2026, an Asian price premium attracted flexible LNG cargoes from Europe to Asia. If disruptions persist and winter demand rises, European buyers must compete for limited additional volumes. The smaller storage buffer leaves less time to wait out that competition. IEA, July 2026.
During Scholz’s visit to the United Arab Emirates in September 2022, an initial LNG cargo of 137.000 cubic metres was agreed; the importer reported its arrival in Brunsbüttel on 15.02.2023. There was also a memorandum of understanding for multi-year deliveries. Such an understanding does not establish a specific annual volume deliverable today. Agreement, 2022; Arrival, 2023. Cubic metres of LNG must not be equated with cubic metres of gaseous natural gas.
The price channel has already been observed: the IEA describes an Asian price premium from March to June 2026 that diverted flexible LNG cargoes from Europe to Asia. In the IEA’s dollar-based analysis, the European TTF price in the second quarter was on average 32 percent above the previous year. IEA, July 2026: observed volumes and prices. This does not establish either a complete blockade or a complete reopening of the strait on 3 October.
The Qatar contracts signed in 2022 provide for at least 15 years of supply. Political support, a commercial contract, terminal readiness and an actual cargo arrival are different steps. The current delay to the start of the German contract is attributed to the terminal in the government footnote; it must not be attributed to the Middle East conflict without further evidence. Continued disruption to production or sea routes could also make future deliveries more difficult.
26,63 TWh: replacement purchases need time and available volumes
The 2024/25 reference case requires 26,63 TWh more than was stored on 30 September. This additional cover would be needed across the winter, in each case before the threatened shortfall. Ongoing deliveries are already included in the historical net withdrawals. The balance therefore has to improve: more net inflows or less consumption. Storage data do not show which additional volumes are already secured by contract.
26,63 TWh is equivalent to around 12,1 weeks of Germany’s entire LNG inflow from 24.–30. September. Deliveries then amounted to 2,2 TWh per week. These deliveries already serve demand; they are not a free additional offer. The comparison shows scale, not a delivery deadline. Bundesnetzagentur: weekly flows.
According to the transmission system operators, alternative LNG deliveries require two to six weeks’ lead time, depending on the route. Cargo, landing capacity and onward transport must also be available. Terminal utilisation of 48,8 percent in that September week does not prove that a cargo can be purchased immediately. FNB Gas; Bundesnetzagentur.
Gas buyers and suppliers must procure these volumes, not individual households in the LNG market. Possible additional costs reach customers later, depending on their contract. Households face price risk when prices are reset or contracts change. Property managers must review heat budgets, instalments and possible balancing payments when contracted costs change. Businesses must finance open volumes or adjust consumption. If volumes do not arrive in time, a price risk becomes a volume problem. This does not imply a blanket reduction for every household.
Calculation example · procurement period is an assumption
The later the delivery, the larger the daily task.
The same additional volume over 30 days requires more than six times the daily capacity needed when spread across the whole winter.
- 26,63 TWh over 182 days
- 146,34 GWh additional per day
- The same volume over 30 days
- 887,81 GWh additional per day
2–6 weeks’ lead time is the lead time stated by transmission system operators for alternative LNG deliveries. It is not a delivery guarantee for 26,63 TWh.
Using the unrounded model requirement of 26,63417 TWh: spread over 182 winter days, around 146,34 GWh of additional cover would be needed each day. If it all came additionally through German LNG terminals, that would mean around 46,56 percent more than the latest measured weekly inflow, sustained across the entire winter. Within a hypothetical 30-day period, the requirement would be around 887,81 GWh a day. The later the response starts, the greater the daily additional capacity required. This is neither a predicted shortage duration nor evidence of freely available supply volumes.
Possible routes include additional LNG cargoes and higher net inflows through the European network. LNG can arrive at German terminals or in neighbouring countries; Norway, the Netherlands and Belgium are important pipeline routes. Additional gas requires available volumes, secured delivery and transport to the point of consumption together. The Bundesnetzagentur stresses LNG’s lead time compared with stored gas, while also considering sufficient gas available for procurement in the market. Bundesnetzagentur: supply routes and lead times.
LNG cargoes already at sea may be diverted more quickly in some circumstances. The cited two to six weeks guarantee neither a particular volume nor a delivery date. The public sources examined do not specify a binding, immediately available additional German volume of 26,63 TWh. Equally, there is no evidence that it cannot be procured. The FNB statement is dated 27.05.2026.
Six low storage reports deserve attention
The six lowest current GIE reporting units were below 20 percent on 30.09.2026. A reporting series can represent part of a capacity or a storage product; it does not always correspond to a whole site. GIE AGSI+.
Size matters too. The separately reported series for Rehden and Breitbrunn together contain only 5,70 TWh against 47,16 TWh of working gas capacity. The unfilled 41,455 TWh represents 39,85 percent of the 104,033 TWh of empty working gas space in the German aggregate. This distance from 100 percent is neither an established winter requirement nor a gap against a statutory target.
Frankenthal reports zero percent. For 2026/27, the operator shows zero of 100 fixed packages booked and no operational shutdowns when checked on 3 October. This describes the booking situation, not the reasons behind it. Operator information.
Rehden has a low fill level but increased in September: up 1,46 TWh, from 8,54 to 12,63 percent. The announced maintenance from 27 September to 16 October alone does not explain the low stock over preceding months. Decommissioning applications for Breitbrunn and Wolfersberg concern spring 2027; they do not establish a closure today. Site evidence and definitions are set out below.
Low stocks can also limit daily delivery capacity. Storage characteristics, pressure, maintenance and the network connection determine how much gas actually leaves. Three low series belong to sites in Upper Bavaria. This does not, however, establish a calculable local shutdown risk: gas is not automatically reserved for the nearest town. The facility comparison and European overview add context.
| Reporting unit | Fill level | Stock · TWh | Working gas capacity · TWh | Unfilled · TWh | Location |
|---|---|---|---|---|---|
| Frankenthal | 0,00 % | 0,00 | 1,00 | 1,00 | Frankenthal, Rhineland-Palatinate |
| Wolfersberg | 0,39 % | 0,02 | 4,09 | 4,07 | Oberpframmern, Bavaria |
| Breitbrunn | 10,43 % | 1,19 | 11,42 | 10,23 | Breitbrunn/Eggstätt near Gstadt am Chiemsee, Bavaria |
| Inzenham-West | 11,07 % | 0,53 | 4,80 | 4,27 | Schechen near Rosenheim, Bavaria |
| Rehden | 12,63 % | 4,51 | 35,74 | 31,23 | Rehden, Lower Saxony |
| Nüttermoor H-2 | 16,18 % | 0,41 | 2,51 | 2,10 | Nüttermoor/Leer, Lower Saxony |
Unfilled = reported working gas capacity minus stock. Not a statutory target gap. Rehden here refers to its separately reported share; storage zones and other site shares are not assigned. Nüttermoor H-2 is only an H-gas subseries for the site. Source: GIE AGSI+, saved retrieval from 02.10.2026; calculation by OPTUM.
Rehden: a low reported share, not an unchecked whole-site figure. The separately listed series reports 12,63 percent and 4,51 TWh. Since April, SEFE has shown around 35,74 TWh of working gas capacity for it. Storage Zone North additionally combines technical options at Rehden and Jemgum; its separately reported 7,41 TWh cannot simply be allocated to either site without a physical attribution. SEFE: Rehden capacities and Storage Zone North. SEFE documents the product structure in its 2024 management report, Storage Zone North section.
The reported Rehden stock rose by 1,46 TWh from 31 August, from 8,54 to 12,63 percent with unchanged reported capacity. This is a traceable increase, still at a low level. SEFE announced scheduled maintenance from 27 September to 16 October. These time-limited works alone do not explain the low stock over preceding months; the announcement also does not quantify today’s withdrawal limit. SEFE announcement, 24.09.2026.
Breitbrunn and Wolfersberg: separate historical problems from future decisions. For Breitbrunn, Uniper documented unfavourable marketing conditions and a missed filling trajectory in storage year 2025/26. This establishes an earlier conflict between economics and filling, but not automatically the cause of the September 2026 stock. The proposed decommissioning on 31 March 2027 is likewise not evidence of a closure today. For Wolfersberg, the operator cites a decommissioning application for 1 April 2027; we do not claim approval or completed decommissioning. Uniper: filling trajectory, 2025, Breitbrunn decommissioning application and bayernugs: Wolfersberg.
What are the technical implications? Less working gas means less stored buffer in that unit. Falling storage pressure can also reduce daily withdrawal capacity. Porous storage typically serves seasonal volumes, while caverns generally respond faster. Assessing how much a specific facility can actually deliver requires its performance curve, available equipment, maintenance, gas quality and transport capacity. Declared maximum capacity is not capacity available at every moment. Even 0 percent working gas does not mean that the cushion gas required for operation has disappeared. Uniper: storage technology, EWE: fill-dependent performance curves and Bundesnetzagentur: working gas and cushion gas.
Where are the low reporting series? Three belong to sites in Upper Bavaria: Wolfersberg in Oberpframmern, Breitbrunn/Eggstätt near Gstadt am Chiemsee and Inzenham-West in Schechen near Rosenheim. Rehden and Nüttermoor are in Lower Saxony, Frankenthal in Rhineland-Palatinate. Nüttermoor H-2 denotes a separately reported H-gas unit, not a hydrogen store or the whole site. The locations are confirmed by site information for Breitbrunn and Inzenham, Wolfersberg’s operator and the Nüttermoor site overview.
What does this mean for the region? Low storage nearby warrants a closer look at network connections and ongoing inflows. Gas in a store is not automatically reserved for the nearest town: Rehden connects to several transmission networks, and Nüttermoor H-2 has access to the THE and TTF market areas. Geographic clustering alone therefore does not establish a calculable regional supply gap or shutdown risk. Likewise, a good EU average cannot replace a local supply balance. The Bundesnetzagentur continued to rate supply as stable in its report of 2 October. Rehden’s network connection and Bundesnetzagentur situation report. The current comparison of individual storage reports and open European overview should be read together.
Legal timing: the general requirement for 1 November is 80 percent per facility; six named facilities, including Frankenthal and Rehden, have a 45 percent requirement. A September figure below this does not, by itself, prove a breach of the November deadline. Reporting and precautionary mechanisms can nevertheless apply earlier. Virtual zones cannot readily be treated as individual legal facilities. GasSpFüllstV and § 35b EnWG.
What we do not know: stocks do not reveal complete booking motives, ownership positions or ongoing technical availability. Breitbrunn has no complete historical series through September 2026; the confirmed reference-date value is separate. A September 2026 trend cannot be calculated from it. Capacity changes also complicate some year-on-year comparisons. We therefore do not publish guessed regional shutdown dates or days of supply.
Gas volume is not the same as delivery capacity
A high price creates neither an immediate LNG cargo nor additional pipeline capacity. Gas must arrive in time, be regasified and transported onwards. Storage bridges delays; daily capacity can decline as fill levels fall. The ENTSOG methodology accounts for withdrawal curves and network limits. ENTSOG, pages 47–49.
Our volume calculation does not test this peak capacity. A positive winter closing balance therefore cannot rule out shortages on individual cold days. Regional assessments require actual flows, usable transport capacity and demand peaks.
Simplified illustration · no measured data
Same fill level. Different gas volumes.
The percentage relates stock to the respective working gas capacity. The energy volume in TWh makes differences in size visible.
Smaller storage facility
50 %Fewer TWh in storageLarger storage facility
50 %More TWh in storageBoth half full
A small, nearly full store is therefore not automatically safer than a large, half-full one, and gas available across Europe is not immediately usable everywhere. The European overview with percentages and TWh shows reported reserves. A reliable local shortage calculation would also require actual gas flows, usable capacities, demand peaks and the duration of any outage.
How does risk show up on the bill?
The record phase in 2022 shows the scale. The calculation examples show which volumes would be exposed to a price rise today.
Gas for the same delivery year, 2023, rose from 50,65 to 293,73 €/MWh — around 5,8 times the earlier price. The contemporary situation report showed storage 81,28 percent full. Existing gas did not prevent the price shock.
The same gas volume. Almost six times the cost.
Bars show procurement costs. All three cards use the same scale.
1 million kWh Gas
- Earlier price
- 50.650 €
- 25 August 2022
- 293.730 €
- Calculated additional amount
- +243.080 €
3 million kWh Gas
- Earlier price
- 151.950 €
- 25 August 2022
- 881.190 €
- Calculated additional amount
- +729.240 €
5 million kWh Gas
- Earlier price
- 253.250 €
- 25 August 2022
- 1.468.650 €
- Calculated additional amount
- +1.215.400 €
For 5 million kWh, the calculated additional amount alone exceeds one million euros.
How the additional amount is calculated
1 million kWh × (29,373 − 5,065) ct/kWh ÷ 100 = 243.080 €. For three or five million kWh, this amount is multiplied by three or five respectively.
2022 · simplified chain of effects
Why gas became extremely expensive despite existing stocks
-
Deliveries cut
Russian deliveries were significantly cut.
-
Winter risk rises
Winter uncertainty and additional purchases coincided.
-
Procurement becomes more expensive
THE gas for 2023 rose to around 5,8 times the earlier price.
-
Open volumes affected
Purchase timing and price arrangements were decisive.
For three million kWh, an assumed increase of 10 ct/kWh adds 300.000 euros. A price advantage of 0,1 ct/kWh saves 3.000 euros. What matters is the volume that still needs to be purchased.
Possible transmission path · not a price forecast
Fear can precede a shortage.
Even expected shortages can trigger buying pressure. Whether this produces higher costs depends on supply, demand and contracts.
Price risk arises before a physical gap. Actual purchases brought forward can increase today’s demand. Financial hedging can limit price risk but creates no additional gas volume.
Compare additional costs for 1, 3 and 5 million kWh
| Gas price rises by | 1 million kWh of gas | 3 million kWh of gas | 5 million kWh of gas |
|---|---|---|---|
| 0,1 ct/kWh | 1.000 € | 3.000 € | 5.000 € |
| 1 ct/kWh | 10.000 € | 30.000 € | 50.000 € |
| 2,5 ct/kWh | 25.000 € | 75.000 € | 125.000 € |
| 5 ct/kWh | 50.000 € | 150.000 € | 250.000 € |
| 10 ct/kWh | 100.000 € | 300.000 € | 500.000 € |
Calculation examples, not a price forecast: volume × price change. 1 ct/kWh = 10 €/MWh; 10 ct/kWh = 100 €/MWh. Each calculation applies the higher price to the entire stated gas volume. If 30 % of the volume is affected, 30 % of the additional costs shown arise. Net of tax, with no changes to taxes, network charges or other price components. Gas energy for heat is not the same as usable heat after plant losses; the calculation does not change existing fixed prices.
Higher gas prices can also drive electricity prices through needed gas-fired plants. In the model, a 10 €/MWh gas increase adds 20 €/MWh in fuel costs for electricity. The individual bill depends on the market and contract.
Gas → electricity · conditional cost lever
How the gas price can reach the electricity bill
-
Gas becomes more expensive
Fuel for the power plant costs more.
-
Generation costs more
Assumption: 2 MWh of gas per MWh of electricity.
-
Wholesale price can rise
When gas is needed to meet demand and sets the price.
-
New contracts respond
Open volumes and renewals can be repriced.
Calculation model:+10 €/MWh gas→+20 €/MWh electricity= 2 ct/kWh electricity
Figures, context and sources for this section
Conditional calculation from 143,49 TWh on 30.09.2026 to the end of March 2027: historical net withdrawals are applied to the smaller opening stock. Additional net inflows or savings can improve the balance. On 02.10.2026, the Bundesnetzagentur rated supply as stable and the risk of shortages as low. A future price shock is a risk scenario, not an established outcome.
Gas was available in 2022. Its price still multiplied.
From 50,65 to 293,73 €/MWh for the same delivery year. Gas for 2023 at the German THE trading hub cost around 5,8 times its average price from 1 January to 23 February 2022 on 25 August 2022 at 18:45. That is a wholesale increase from 5,065 to 29,373 ct/kWh — 24,308 ct/kWh more. The Bundesnetzagentur documents both figures in the same situation report. Price table on page 7.
Storage was far from empty. The situation report of 26 August 2022 showed a fill level of 81,28 percent, referring to the storage date of 24 August, and supply that was stable at that moment. The authority also warned of sharply rising customer prices. Nord Stream was delivering only around one fifth of its maximum capacity. Bundesnetzagentur: contemporary situation report.
Having gas does not protect against an extreme price for the next volume. Real supply cuts, concern about the coming winter and additional procurement pressure came together. Buyers with volumes secured cheaply were in a different position from those needing fresh purchases at short notice. For parts of industry, energy costs meant production cuts; high collateral requirements also put suppliers under liquidity pressure. IEA; ECB.
What this meant for buyers: the same gas volume cost almost six times as much at the later wholesale price. For three million kWh, the comparison produces an additional 729.240 euros. The graphic shows the calculation for three consumption volumes.
| Observation | Wholesale price | Converted per kWh of gas |
|---|---|---|
| Average 01.01.–23.02.2022 | 50,65 €/MWh | 5,065 ct/kWh |
| 25.08.2022, 18:45 | 293,73 €/MWh | 29,373 ct/kWh |
| Difference | 243,08 €/MWh | 24,308 ct/kWh |
Source: BNetzA situation report of 26.08.2022, page 7. An average over a period is compared with a later snapshot for the same delivery year. Wholesale, excluding retail components; not a forecast. Ratio 293,73 ÷ 50,65 = around 5,8; increase around 480 %.
339 €/MWh — equivalent to 33,9 ct/kWh of gas at wholesale. The ECB reports this record TTF level for late August 2022; it was around 18 times the level at the beginning of 2021. The low starting price helps explain the size of that multiple. This was a futures-market peak, not an annual average or a household tariff. ECB: price developments in 2021/22.
What 2022 demonstrates — and what it does not: according to the ECB, real Russian supply cuts were the main trigger of the energy shock. These sources would not support saying “fear was the biggest driver.” They do document strong reactions to uncertainty and liquidity pressure from higher collateral requirements in futures trading. ECB, November 2022.
In August 2022, ESMA observed, among other developments, electricity companies rapidly building buying positions. Required collateral was nevertheless provided; the study does not document a general collapse in market liquidity. Panic is therefore not a blanket explanation for every price movement. ESMA: August 2022.
The market does not wait until gas runs short. According to the IEA, European gas prices rose by 50 percent from the previous day on 24 February 2022. Flows through Ukraine into Slovakia were not yet affected that day. This shows how quickly fear of further disruptions can move prices. IEA: situation on 24.02.2022.
2026 starts from a different position. Import routes, demand, infrastructure and political risks have changed. The delivery year and starting price of a specific offer also differ. The historical factor of 18 is therefore not a forecast for a current contract. What matters is the absolute cost increase on the actual unhedged volume.
The same increase, a different multiple: with an assumed starting price of 5 ct/kWh, another 10 ct/kWh raises it to 15 ct/kWh — three times the original price. With an assumed starting price of 10 ct/kWh, it rises to 20 ct/kWh — twice the original price. Both cases increase procurement costs by 10 ct/kWh. The starting prices are calculation assumptions, not current market offers.
Storage need not be empty for a price shock
Fear can bring demand forward and intensify a rally. When many market participants buy additional physical volumes at the same time, procurement pressure rises. Futures hedging can also move prices. Newly traded or repriced gas from existing stocks can become more expensive too. Existing fixed-price contracts do not automatically increase as a result. Our concern focuses on open volumes and expiring price arrangements.
What does that mean for heat supply? Whether one site or several properties, the calculation depends on the gas volume. With three million kWh of gas used for heat, an assumed increase of 10 ct/kWh already costs 300.000 euros extra if the full volume has to be purchased at the higher price. A tenth of a cent price advantage on the same volume saves 3.000 euros. Both deserve attention — but they are very different orders of magnitude.
Even at 500.000 kWh, an extra 1 ct/kWh in procurement costs would mean 5.000 euros. For property managers with 20 to 30 million kWh of affected gas volume, the figure would be 200.000 to 300.000 euros; at an assumed 10 ct/kWh, two to three million euros. The whole annual volume is affected only if it is all purchased at the higher price. Allocation to individual buildings, owners and tenants depends on contracts, consumption and billing.
Credible additional deliveries, mild weather or lower demand can ease expectations and prices. A stock reduction of 25 percent does not imply a specific percentage price increase. Costs at an individual site depend on building size, use, weather and efficiency.
A gas shock can reach electricity and heating bills
Gas-fired plants can set the wholesale electricity price. When their generation is needed to meet demand, higher gas costs can drive the price. Wind, solar, other plants, storage and imports change this effect in each market period. The European Commission describes a weaker but continuing link. European Commission.
The cost lever: ten euros more per MWh of gas means, in the model, 20 euros more in fuel costs per MWh of electricity — two cents per kWh. The assumption is two MWh of gas per MWh of electricity on the same energy basis; CO₂ and other costs remain constant. ECB, 24.09.2026.
The contract determines the individual bill. Fixed prices do not automatically move with the exchange; open volumes, new contracts and renewals face repricing risk. Network charges and taxes also play a part. District heating depends on the local generation mix and price formula. Price components; § 24 AVBFernwärmeV.
Goods and services can also become more expensive if energy, transport and input costs remain higher. Competition, contracts and margins determine pass-through. Our gas balance implies neither a fixed retail surcharge nor a blackout.
| Gas price increases by | Additional fuel costs per MWh of electricity | Equivalent per kWh of electricity |
|---|---|---|
| 10 €/MWh gas | 20 €/MWh electricity | 2 ct/kWh |
| 25 €/MWh gas | 50 €/MWh electricity | 5 ct/kWh |
| 50 €/MWh gas | 100 €/MWh electricity | 10 ct/kWh |
Calculation examples, not a forecast of a gas price increase. CO₂ and other costs constant; no extrapolation to the annual wholesale price or a retail tariff. Price effects depend on the generation that actually sets the price.
20.01.2025 illustrates how tight individual periods can become: from 17 to 18, the German day-ahead price reached 583,40 euros per MWh. Expected consumption was 69,7 GWh, with only 3,4 GWh of wind and solar generation. This demonstrates a price spike with high remaining demand for other generation, not isolated proof of a gas-price effect. SMARD: 2025 annual assessment.
The plant’s additional cost affects the market price accordingly only if gas is actually price-setting and offers pass on those costs. The table is not an extrapolation to the annual wholesale price or a retail tariff.
Diesel +50 percent: cost chains are already under pressure
In September 2026, E10 cost 36,0 percent and diesel 50,3 percent more than a year earlier. This follows from the full ADAC monthly averages in the table. The fuel-tax relief from October is not yet included. ADAC 2025; ADAC 2026; Tax relief.
Oil and gas are both exposed to disruptions in international supply routes. The German government attributes the latest fuel cost pressure to the Middle East conflict; the IEA documents a temporary loss of almost one fifth of global LNG supply in March 2026. This demonstrates a shared shock channel, not a fixed price relationship. IEA, review of March.
Refineries, distribution and taxes also affect fuel prices. Businesses can nevertheless face a combined increase in transport, gas, electricity and input costs. A hedged gas price does not protect the entire cost chain.
| Fuel | September 2025 · €/l | September 2026 · €/l | Change |
|---|---|---|---|
| Petrol E10 | 1,666 | 2,266 | +60,0 ct / +36,0 % |
| Diesel | 1,587 | 2,386 | +79,9 ct / +50,3 % |
Our percentage calculation from the ADAC monthly averages. These are not daily prices for 03.10.2026 or a predicted increase in gas or electricity tariffs. Tax changes from October are not yet included in these September figures.
The comparison describes September’s cost situation. Prices from October must account for the new tax relief: the Bundestag and Bundesrat approved a reduction effective 1 October. A subsequent fall at the pump would therefore not, by itself, prove that global supply conditions had eased. German government: tax relief from October.
What does this mean for businesses and buyers?
Open volumes, delivery capability and decision deadlines need to be considered together.
Industrial gas demand in OECD Europe fell in 2022 partly through production cuts. High costs can strain orders and liquidity before gas runs short. Your own fixed price does not automatically protect your supply chain.
Industry · possible cost path
Gas can flow while production comes under pressure
-
Energy purchases become more expensive
Higher energy costs affect newly procured volumes.
-
Margins and liquidity
Orders may no longer cover the additional costs.
-
Shifts under pressure
Production is reduced under stress.
-
Supplies affected
Inputs, dates and costs can change.

Contract expiry should determine the planning deadline — not when planning begins. Check open volumes, cancellation deadlines, comparable offers and ability to deliver early. In a crisis, higher prices and fewer offers can occur together.
Procurement · room to act before contract expiry
Four steps before the calendar forces a purchase
-
Check deadlines
Identify contract expiry and cancellation deadlines early.
-
Identify open volumes
Clarify consumption, load profile and tolerable price risk.
-
Review offers
Compare like-for-like services; review ability to deliver and contract terms.
-
Decide in time
Choose before the deadline, while alternatives can still be reviewed.
Figures, context and sources for this section
Conditional calculation from 143,49 TWh on 30.09.2026 to the end of March 2027: historical net withdrawals are applied to the smaller opening stock. Additional net inflows or savings can improve the balance. On 02.10.2026, the Bundesnetzagentur rated supply as stable and the risk of shortages as low. A future price shock is a risk scenario, not an established outcome.
Production can stop while gas is still flowing
Available does not mean affordable. If an order does not cover its additional energy costs, shifts and production come under pressure. The IEA estimates a 15 percent decline in industrial gas demand in OECD Europe from January to August 2022, associated with production cuts. IEA: the 2022 crisis.
Even a hedged customer can lose a supplier. Under stress, delivery dates shift, inputs go missing or costs rise. For your own operation, minimum consumption, safe shutdown time and restart effort therefore matter. The reduction that is technically possible must be checked for each plant.
When procurement and savings are not enough
If market measures remain insufficient and the German government declares the emergency stage, the Bundesnetzagentur takes over national gas allocation. It can limit gas consumption and order shutdowns if necessary. There is no fixed shutdown list by sector. Bundesnetzagentur.
Households and other protected customers have priority. § 53a EnWG includes standard load profiles, essential social services and certain heat supply cases, among others. This protection is not an unlimited physical guarantee, but today’s reserve does not establish an imminent household shutdown. § 53a EnWG.
Assess price risk and ability to deliver separately
An agreed price and physically deliverable gas answer different questions.
Which costs apply to which volumes and periods?
Can the gas reach the required location in time?
There is no predetermined shutdown list by sector. Decisions depend on gas flows, network conditions and the consequences of a reduction, among other factors. Even a business considered important cannot obtain statutory protected status by application. Bundesnetzagentur: case-by-case decisions and protected customers.
Protection extends beyond private households: § 53a EnWG includes customers with standard load profiles, essential social services and certain heat supply cases. District heating plants must meet conditions, and protection covers the necessary share of heat deliveries. The specific connection and use must therefore be checked. § 53a Energy Industry Act.
Priority supply is still not an unlimited physical guarantee. If even essential demand could not be fully met despite all available measures, that would be the most severe escalation of this scenario. It cannot be inferred from today’s storage level. Nor does the emergency stage automatically end trading: according to the shared understanding of the Bundesnetzagentur, THE and EEX, the gas spot market should generally remain open. Bundesnetzagentur: trading at the virtual trading point in the emergency stage.
Contract expiry is a deadline. Not a buying strategy.
We are already receiving enquiries for gas and electricity in 2027 where buyers negotiate over 0,1 ct/kWh. That matters at large volumes. Equally relevant is the question: how robust are the price and delivery promise if the market comes under stress again? The last decimal place cannot replace a review of contract terms and the supplier’s financial capability.
A strikingly cheap offer deserves questions, not a premature verdict. Earlier procurement, lower costs or different services can explain price differences. A 2027 offer must be compared over the same delivery period, similar volumes and load profiles, and the same scope of guarantees. Today’s wholesale price alone proves neither inadequate hedging nor security.
Choice can disappear in a crisis too. In 2021/22, several suppliers suspended new customer intake. An announcement of 10 March 2022 explicitly cites rejected procurement enquiries and temporarily unavailable additional purchasing options — while supply to existing customers was secured. Buyers seeking replacement under time pressure can face higher prices and fewer offers at once. Case documented at the time.
Property managers are responsible for heat budgets for owners and tenants. With annual demand of 20 to 30 million kWh, just one cent of additional cost can amount to hundreds of thousands of euros. Delayed purchasing can strain liquidity planning, instalments and possible balancing payments. Businesses with one, three or five million kWh also have real money at stake.
Our recommendation: prepare procurement while room to act remains. Identify contractual and cancellation deadlines, open volumes and tolerable price risks early; review comparable offers and supply terms. Purchasing in tranches can also be considered if it suits consumption and the contract. Early planning does not guarantee the lowest price. It creates time to make a decision before the calendar forces one.
What happens if a supplier fails? Insolvency alone does not mean deliveries stop. If consumption is no longer assigned to a fulfilled supply contract, final consumers connected at low voltage or low pressure generally enter replacement supply — for no more than three months, at separate and often higher prices. Commercial customers can also qualify. Annual volume alone is not decisive. Bundesnetzagentur; § 38 EnWG.
At medium voltage or medium pressure, a locally agreed transitional supply under § 38a EnWG may exist. The connection and local rules must be checked. A safety net does not promise continuation of the previous price. Supplier failure must also be distinguished from a physical gas shortage. § 38a EnWG.
Offer comparisons should cover price guarantees and exceptions, volume flexibility, payment terms, price-change and termination clauses, and available information on creditworthiness and hedging. A low price alone does not prove an unreliable business model; a contract cannot exclude every future event either. § 41 EnWG; Bundesnetzagentur: prices and guarantees.
Further sales pauses at the time are documented for 27.10.2021 and 04.01.2022. These are reports by the individual providers about their own business, not evidence of widespread sales stops today.
Our assessment
Less reserve requires more preparation. Prices can react before a physical gap develops.
A smaller buffer leaves less room for wrong assumptions and late responses. Price risks can develop before a physical gap. Negotiating over 0,1 cents is legitimate. Leaving risks of several cents unchecked is not economically sound.
Figures, context and sources for this section
Conditional calculation from 143,49 TWh on 30.09.2026 to the end of March 2027: historical net withdrawals are applied to the smaller opening stock. Additional net inflows or savings can improve the balance. On 02.10.2026, the Bundesnetzagentur rated supply as stable and the risk of shortages as low. A future price shock is a risk scenario, not an established outcome.
Our conclusion: waiting for a shortage gives up room to act
The smaller storage buffer leaves less room for wrong assumptions and delayed responses. Withdrawals like 2024/25 require 26,63 TWh of additional cover beyond the opening stock. If it does not arrive in time, consumption must fall. Fear of that can make newly traded volumes more expensive beforehand. For households, property managers and businesses, open volumes, price arrangements and reliable delivery commitments therefore matter. Negotiating over 0,1 cents is legitimate. Leaving a risk of several cents unchecked is not economically sound. Contract expiry should determine the planning deadline — not when planning begins.
The Bundesnetzagentur rates current supply as stable. Our conclusion is a precautionary assessment based on conditional calculations, not a claim of a shortage today. More timely net inflows or lower demand improve the balance. The monitor and Bundesnetzagentur provide ongoing checks.
Practical checks include open procurement volumes, price resets, essential minimum consumption and financial headroom. Further information: gas procurement for businesses and energy for property managers.
Data status: GIE gas day 30.09.2026, saved retrieval 02.10.2026. Consumption and source checks on 03.10.2026; complete current monthly consumption figures through August. Fuel comparison: September 2025 and September 2026. Stocks, flows and consumption data can be revised.
Check all sources and the methodology
- GIE AGSI+: stock and fill-level data
- Bundesnetzagentur: situation assessment of 02.10.2026
- IEA: Gas Market Report Q3-2026 — LNG, prices and demand
- ENTSOG: Summer Supply Outlook 2026 — winter overview and modelling methodology
- European Commission, 21.05.2026: LNG competition and gas–electricity links
- European Commission: energy prices, procurement and customer pass-through
- Bundesnetzagentur: national gas allocation
- Bundesnetzagentur: decisions for businesses
- § 53a EnWG: legally protected gas supply
- Bundesnetzagentur: gas spot market in the emergency stage
- Enovos: Frankenthal, fixed packages and operational shutdowns · retrieved 03.10.2026
- SEFE: separately published Rehden capacities · retrieved 03.10.2026
- SEFE: own capacity for Storage Zone North · retrieved 03.10.2026
- SEFE, 24.09.2026: Rehden maintenance 27.09.–16.10.2026
- Uniper, 04.06.2025: historical Breitbrunn filling trajectory 2025/26
- Uniper, 02.10.2025: Breitbrunn decommissioning application
- bayernugs: application for Wolfersberg effective 01.04.2027 · retrieved 03.10.2026
- Uniper: porous storage and caverns · retrieved 03.10.2026
- EWE: capacities and fill-dependent withdrawal · retrieved 03.10.2026
- Bundesnetzagentur: working gas, cushion gas and late reports
- GasSpFüllstV: November/February requirements, valid through 31.03.2027
- § 35b EnWG: reference dates and prior obligations
- SEFE Storage: 2024 management report, Storage Zone North structure
- NAFTA: site information for Breitbrunn/Eggstätt and Inzenham-West (August 2024)
- SEFE: Rehden storage site and transmission network connections
- EWE: Nüttermoor and separate H-gas units
- Bundesnetzagentur/THE: monthly total gas consumption · retrieved 03.10.2026
- Bundesnetzagentur: historical monthly household/commercial figures 2018–2021
- Bundesnetzagentur: historical monthly RLM figures 2018–2021
- Bundesnetzagentur: household and commercial consumption, methodology and revisions
- Bundesnetzagentur: large gas customers including gas-fired power generation
- BDEW: heating structure of the 2024 housing stock, as of July 2025
- Bundesnetzagentur: 2025 gas supply annual review
- Bundesnetzagentur: 2022 annual review with 2021 consumption
- ECB, Economic Bulletin 4/2022: low stocks, expectations and price volatility
- IEA: Gas Market Report Q4/2022 — volatility, financing and industry
- IEA: Gas Market Report Q2/2026 — LNG outages and prices in March 2026
- ADAC, 01.10.2025: monthly fuel averages for September 2025
- ADAC, 01.10.2026: monthly fuel averages for September 2026
- German government, 25.09.2026: energy tax reduction from October
- Bundesnetzagentur: gas supply FAQ, retrieved 03.10.2026
- German government, 05.02.2026: corrected expected start of Qatari deliveries in 2027
- IEA: Strait of Hormuz, historical LNG route exposure in 2025
- Primary announcement, 28.09.2026: Qatari delivery outages to Italy until early December
- ECB, 24.09.2026: wholesale prices, power plant costs and retail pass-through
- Bundesnetzagentur: gas and electricity price components
- § 24 AVBFernwärmeV: price adjustment clauses, checked 03.10.2026
- SMARD, 05.01.2026: electricity market in 2025, load and price spikes
- DWD: climate forecasts, access and limits of interpretation
- ECMWF, September 2026: Evaluation of ECMWF forecasts
- ECMWF, April 2024: underestimated cold winter in Northern Europe
- Rantanen et al., first published 06.05.2024: Fennoscandia, ensemble comparison and 31-year assessment
- ECMWF, July 2023: forecast performance in winter 2022/23
- DWD, 16.03.2018: mild winter 2017/18 with a cold spell in late February
- Met Office, 11.09.2026: seasonal UK outlook, not a forecast for Germany
- ECMWF SEAS5 User Guide: publication and uncertainty
- FNB Gas, 27.05.2026: security of supply report, two to six weeks’ LNG lead time
- IEA 2022: price reaction on 24 February, Russian flows and stocks in 2021/22
- ECB, November 2022: TTF peaks and liquidity risks
- ESMA, October 2023: analysis of the gas price surge in August 2022
- § 38 EnWG: replacement supply
- § 38a EnWG: locally agreed transitional supply
- § 41 EnWG: energy supply contracts
- Bundesnetzagentur: insolvency and an actual delivery stop
- Bundesnetzagentur: prices and price guarantees
- Bundesnetzagentur, 26.08.2022: stable supply, storage 81,28 % full on 24.08. and high prices
- Bundesnetzagentur, 12.01.2026: gas import structure across 2025
- Original announcement, 10.03.2022: halt to new gas customers and rejected procurement enquiries
- Original announcement, 27.10.2021: electricity and gas sales pause
- Original announcement, 04.01.2022: halt to new customers
- Contract announcement, 29.11.2022: up to 2 million tonnes of Qatari LNG annually, at least 15 years
- Agreement during Scholz’s visit, September 2022: initial UAE LNG cargo and memorandum of understanding
- Arrival announcement, 15.02.2023: 137.000 cubic metres of LNG from Abu Dhabi
- Gassco: transport network, Europipe I/II and Norpipe
- EIA, September 2024: storms and LNG export interruptions
Stock comparison on 30 September in each year: TWh difference and relative decline refer to the previous year’s stock; percentage points refer to the reported fill level. Conditional projections: opening stock 143,4933 TWh on 30.09.2026, historical seasonal gross withdrawals minus injections, each from 01.10.–31.03. Negative calculated results denote additional cover requirements, not physically negative storage. The 2023/24 reference includes a leap day. Daily delivery capability and network allocation are not modelled. For 2025/26, 29 of 182 days are estimated; for 2024/25, 22; 2020/21 is entirely estimated and revised. Stock difference 2025/26: 137,3687 TWh; net flows: 137,50965 TWh. These measures remain separate because of revisions/capacity changes. All 5.752 available daily reports were checked for completeness and date boundaries; all 15 complete winters since 2011/12 were analysed internally. Gas consumption: rounded BNetzA/THE monthly averages × calendar days, hence approximate figures; households/commercial users calculated as the SLP residual network load, RLM including power plants. Tables state GWh without an explicit Hs qualifier; no AGEB calorific-value series is mixed in. Annual and monthly releases can contain different revision states. The SLP share is not purely a space-heating share; the BDEW housing share also includes biomethane/LPG. ADAC comparison of complete September months from the same series, before tax relief from October 2026. Historical crisis evidence is dated; future effects are our own conditional assessment. Site chapter: reporting units, virtual zones and physical sites distinguished. No paid API query, price targets or occurrence probabilities. Addition v5: daily net withdrawals applied to the opening stock; lowest interim balances checked as well as the closing balance. Additional stress cases 2016/17 and 2017/18 are entirely estimated historical series; selection does not indicate occurrence probability. Hormuz figures for 2025 and IEA market observations March–June 2026 are historically dated; no complete current transit status is claimed. Qatar contract start expected in 2027 according to corrected government information. Power plant examples assume 2 MWh of gas per MWh of electricity on the same energy basis; no retail price target. Weather review: Fennoscandia ONDJ not equated with Germany DJF. 3/31 are specific historical observations below the ensemble minimum, not a general error probability; 3/552 is a model share for one case. No verified current probability for a German winter is applied. Replacement procurement: 26,63417 TWh of additional cover from the 2024/25 reference; 182 days and a hypothetical 30 days are calculation horizons. The LNG weekly comparison says nothing about available additional volumes or delivery time. Addition v6: procurement costs for 1/3/5 million kWh of gas for heat supply as a conditional net volume calculation, including +10 ct/kWh; no price forecast or equation of gas energy with useful heat. 2021/22 as a dated crisis comparison. Our customer enquiries for 2027 are experience described by the publisher, not representative market statistics. Replacement and transitional supply distinguished by connection type. Additionally: Germany’s import mix for the full year 2025 is explicitly separated from the week 24.–30.09.2026; countries of entry do not constitute complete origin statistics. The 18-fold TTF price compares late August 2022 with early 2021. The 81,28 % storage level on 24.08.2022 comes from the report dated 26.08.; the dates are not equated. Gulf contracts, memoranda of understanding and actual cargoes distinguished; the German government attributes the Qatar delay to the terminal.
Responsible for content: Hasan Sahin.